Author: Helen Thomas

What’s Next for Beauty and Omnichannel Retail

Omnichannel Solutions

In sync with Bloomingdale’s debut this month of a revamped cosmetics floor at its 59th Street flagship, with 75 new brands and 1,100 square feet of additional retail space, the heritage retailer made a modest but interesting investment in its new “Beauty Stylists” program. The purpose? For Bloomingdale’s to further establish an omnichannel beauty experience, which many a retailer from Sephora to Ulta Beauty to Saks Fifth Avenue has signaled is their plan of attack in 2019.

Rather than facilitate cross-beauty brand shopping only in its curated concepts like Space NK, millennial-focused Glowhaus and clean shop Wellchemist, Bloomingdale’s can now encourage shopping across its 200 brands through the stylists in the program. Three stylists were hired for the beauty department’s relaunch (with plans for expansion later this year) and have a dedicated physical space on the 59th Street sales floor. Additionally, for the first time, online customers can book appointments with said stylists on Bloomingdales.com — in the past, appointments could only be made by individual beauty brands.

“It’s the way the customer is shopping today,” said Stacie Borteck, Bloomingdale’s vp and divisional merchandise manager of cosmetics and fragrances. “Our customer wants a seamless online and in-person experience. Our stylists program makes that connection easier.”

The State of Omnichannel Retail in Beauty

Since Amazon upended the brick-and-mortar model, omnichannel has been a buzzword in retail, but beauty players have been slower to embrace the concept. “Beauty was late to e-commerce, because it is so highly experiential and relied so heavily on the consultation aspect and one-on-one advice,” said Simeon Siegel, senior equity analyst at Nomura Securities.
Saks Fifth Avenue launched its online booking feature for in-store beauty appointments in August 2017, in advance of its own revamped beauty experience in May 2018. After the new floor’s debut last year, Saks began sending personalized email notifications to its beauty shopper that have either shopped in-store or online — around 39 different email types are sent a week, from launch reminders to appointment suggestions, said Emily Essner, Saks Fifth Avenue’s svp of marketing and digital. Beauty shoppers currently make up 57 percent of all online appointment requests received by Saks, further emphasizing the retailer’s push for marrying digital with brick-and-mortar in the category. Saks reported that, on a 12-month basis, its omnichannel shoppers spend 1,000 percent more than the online-only shopper and 500 percent more than the offline consumer.

Sephora’s and Ulta Beauty’s respective forays into omnichannel have also been recent. Sephora merged its digital and in-store merchandising teams in September 2017 for what it calls “omnitude.” Though Ulta has been using a newer order management system since 2015 to fuel its omnichannel experience, its store-to-door program, which allows customers to order online in physical locations and have products shipped to their homes, debuted in late 2017. Additionally, its buy-online-pick-up-in-store initiative is still in its nascent phases; currently, it is only available in 47 of its 1,163 locations.

Omnichannel Retail

Is Technology the Answer?Omnichannel in Retail

“Omnichannel continues to be a moving target in beauty,” said Larissa Jensen, executive director and beauty industry analyst at The NPD Group, who called Amazon’s Go convenience stores and Crate and Barrel’s Connected Store, which uses MobileTotes best-in-class omnichannel retail examples. “A lot of retailers get hung up on the technology piece because that moves so quickly, but Glossier is a perfect example of how showrooms can also mimic online: At the end of a trip, a sales associate pulls together all of your items, just like a shopping cart would online.”

In November 2018, Ulta Beauty made its first-ever digital acquisitions (in artificial intelligence and augmented reality startups QM Scientific and GlamST, respectively) and investments (in digital workflow partner Iterate and online booking tool Spruce) to expand its omnichannel experience. According to Ulta, its omnichannel shoppers spend up to four times more than its single-channel guests, and they frequent stores up to four times more often.

“Our data set and having all things beauty, all in one place, gives us a competitive advantage,” said Prama Bhatt, Ulta’s svp of digital and e-commerce. “We have more insight across a broad customer base, and we want to personalize across all channels for each individual.”

In 2019, Ulta Beauty’s connection of QM Scientific’s AI platform, Quasi, to its own customer data will allow the retailer to send more customized recommendations and messaging through emails and on Ulta.com.

Omnichannel RetailMoving Beyond Rote Personalization

But more than pure technology plays or even personalized product, beauty retailers have the opportunity to wrap functionality with sophistication, said Jensen. “A [typical] physical retail store does not offer a customized experience for the customer, but there are ways to give her a customized experience in emails and online. If a customer’s last year’s worth of purchases are skin-care [products], then why is she getting email notifications about the latest makeup launch?”

Stephanie Wissink, Jefferies equity analyst, agreed: “Sephora and Ulta are substantially underutilizing the relationship management systems they have and their ability to connect digital to the physical experience,” she said. “They’re doing the systematic things: buy-online, pick up in-store; search from store; user reviews. They use CRMs to tailor marketing to specific market segmentations, but it feels very formulaic.”

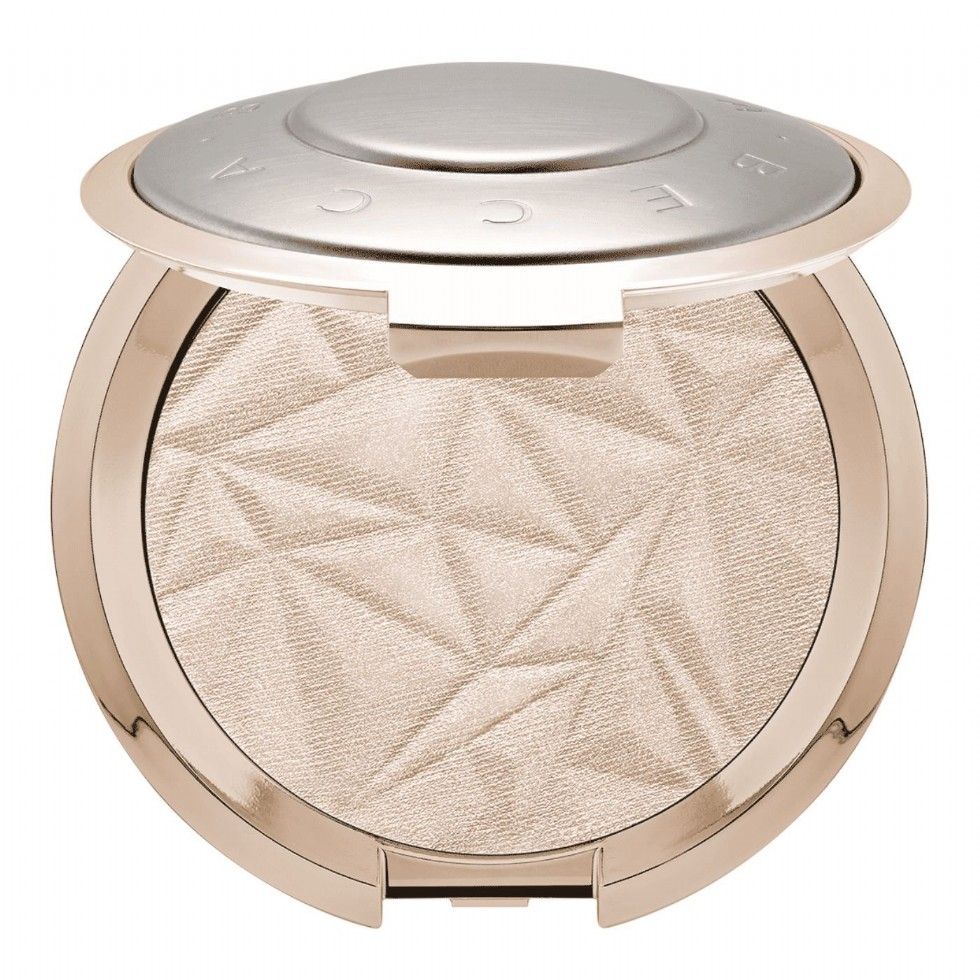
A better use of marketing resources would be for these retailers to leverage their expertise as curators of merchandise into content, said Wissink. “Ulta knows my purchase history. Say I bought a highlighter from Becca. There are thousands of content creators uploading content about the Becca brand to YouTube: how to use it, how to try different colors. Why do I as the customer have to make that connection? Why couldn’t Ulta make that connection in an email, with the new products and YouTube videos combined,” she said. “These retailers have the portal permission to curate, but they need to use that permission as a place for connectivity.”

Siegel said beauty retailers like Sephora and Ulta need to make the right technology and marketing investments to not get left behind. It’s not that they not be leaders, he said — more nimble, younger brands can serve that role. “[Sephora and Ulta] revolutionized beauty shopping once,” he said. “Today, their incremental purchases and investments need to stretch to the whole organization.”Omnichannel in Beauty

Partnering with the Beauty Brands Themselves

As emerging brands and digitally native brands continue to use third-party partnerships to scale — like those with Sephora, Ulta, Bloomingdale’s and Saks Fifth Avenue, leveraging the brand’s know-how can be key for the retailer. (According to Glossy+’s proprietary research panel of industry insiders, 61 percent said the brands they work for are selling through wholesale retailers as part of an omnichannel strategy.)
Natalie Mackey, CEO of The Glow Concept, which owns fast-beauty line Winky Lux, will be sending her head of stores to Sephora sales team meetings beginning this year, so the mega retailer can capture more of the data Winky Lux sees from its existing pop-ups and online site. Third-party partnerships make up 50 percent of the brand’s sales. “We see it as a meeting of the minds,” said Mackey. “We want to give them a ton of data because they allowed us to scale in a way we never could have with online customer acquisition costs and tap a customer we never had before. For us to succeed in an omnichannel way, they have to, as well.”

Wander Beauty co-founder and CEO Divya Gugnani echoed these sentiments: “We know our customer better than anyone else, but because the customer is omnichannel, we have to be,” she said. “For the retailer to get better at omnichannel and knowing the customer, we want to share everything we know.” (The beauty brand sells at Sephora, Nordstrom and Revolve.com.)

If personalization really is the path forward, partnering with the beauty brands themselves allows the retailer to get better with their content curation strategy, too. “A seamless omnichannel experience isn’t just about being frictionless, but it’s also knowing the customer better and delivering on an experience that’s right for her every time,” said Wissink.


This article originally appeared on Glossy.co on January 29, 2019

Calculating Sell-Through

What is sell-through?

Sell-through is a metric for vendors to use in evaluating item performance which provides a composite measure of sales and inventory. Sell-through rates are typically evaluated daily for fast-moving products or weekly for slower-moving or replenishment-based products.  A higher value is better, indicating your sales velocity is good and your inventory is appropriately forecasted. If sell-through is low, this indicates either poor sales or too much inventory.

How do I calculate sell-through?

The most common calculation is:

SELL-THROUGH % = UNITS SOLD / (UNITS ON HAND + UNITS SOLD)

In most cases, sell-through for an item is compared in recent periods (such as current week and last week), as well as in aggregate across several months to a year.

When evaluating sell-through, it can be useful to group together products which have been selling for a similar period of time and/or which are sold into the similar store types. For example, comparing sell-through for a product with 5 weeks of selling activity against a product with 20 weeks of selling activity most likely will not produce a useful comparison. In the same way, comparing sell-through for a product in a group of stores in a highly affluent area is not likely to compare favorably to a group of stores with a low-income level.

What is sell-through data used for?

Sell Through Report

Based on Accelerated Analytics data

Most retail buyers have a set sell-through percentage they use to evaluate vendors based on product category or department.  It is important for vendors to discuss the sell-through expectations with the buyer in order to align with those objectives.

For reference, we’ve compiled sell-through percentage data
that you can use as a benchmark. The infographic includes
the sell-through percentage for eight retail categories
each at 8, 13, 26 and 52 weeks.
Sell-Through Data Tracking


GET STARTED Identify trends, optimize assortments, and track promotions with one-click access to sell-through rates for every one of your SKUs with POS reporting and analytics from Accelerated Analytics!
Find out how we can help you make faster and better-informed decisions with real-time retail data and insightful analytics.

Lowe’s Becomes NFL Official Sponsor

DIY Retailer Lowe's NFL Official Partner

January 22, 2019

Lowe’s has reached a massive deal with the National Football League that makes it the league’s official home-improvement retail sponsor.

The exclusive multiyear partnership will give Lowe’s branding rights and marketing opportunities at key events including the Super Bowl, the NFL draft, and the NFL combine, Lowe’s announced Tuesday. Financial details of the partnership were not disclosed.

The deal could give Lowe’s major marketing leverage over its biggest home-improvement competitor, Home Depot.

“This was a very big strategic move for us” says Jocelyn Wong, chief marketing officer at Lowe’s.

DIY Customers Targeted by Lowe's

In tandem with the partnership, Lowe’s is kicking off a new marketing campaign designed to attract new customers. The campaign specifically targets “heavy do-it-yourselfers” — those customers who take on complicated and highly technical projects — and home-improvement professionals like contractors.
“As we were looking at 2019 and beyond marketing plans we realized we had an opportunity to expand our customer base,” Wong said.

“We do really well with light-DIY customers and want to expand with heavier-DIY customers.”

This strategy appears to be a direct appeal to Home Depot’s customer base. Home-improvement professionals tend to prefer shopping at Home Depot over Lowe’s, according to research by Wedbush Securities.

Professional contracts account for 20% to 25% of sales at Lowe’s and 45% of sales at Home Depot, Wedbush Securities’ Seth Basham told Business Insider’s Áine Cain.
The tagline of the new campaign, “Do It Right,” is designed to appeal to customers who take pride in their home-improvement projects and “believe anything worth doing is worth doing right,” Wong said.
To reach this customer, the new ads will take on a “grittier” and more “authentic” tone than the company’s past campaigns, which were more “whimsical” in nature, Wong said.
“We want Lowe’s to be the place for those people who are going to go the extra mile to do it right,” she said.


This article originally appeared on BusinessInsider.com.

NRF: Retailers Ramp Up Investment in Intelligent Automation

For most consumers, the shopping experience is a lot different than it was a dozen years ago. That’s when Apple released the first iPhone. Now smartphones are ubiquitous, and they’ve had a significant impact on the shopping experience, whether it’s ordering online from our phones or using a phone to check prices or research merchandise while standing in a store. Behind the scenes, retailers have invested heavily in artificial intelligence, the technology that lets computers “learn” and allows retailers to offer recommendations, special discounts or other benefits based on past purchases.

Currently, 40 percent of retail and consumer product companies use intelligent automation. That number will increase to over 80 percent by 2021.

Today, retailers are rapidly becoming involved in “intelligent automation” — a new combination of technology in which automation is driven by artificial intelligence. And it’s an innovation that will change the shopping experience in even more impactful ways than the smartphone has — some obvious and some invisible. Underpinning this significant investment is the goal of increasing operational agility and providing better experiences to remain competitive in a rapidly transforming industry.

Currently, 40 percent of retail and consumer product companies use intelligent automation according to a new global study released by IBM and NRF during NRF 2019: Retail’s Big Show earlier this month. According to the report, that number will increase to over 80 percent by 2021 — a phenomenal increase over a short period of time. Much of this investment will occur either in the supply chain or manifest itself in ways that aren’t apparent in consumers’ everyday interactions with retailers. While the full effect of these investments are yet to be seen, retail is changing in ways that consumers are already experiencing. Imagine shopping online at a retailer that has thousands of products and adds hundreds or even thousands of new ones each day. Using intelligent automation, retailers are personalizing the experience, sifting through reams of data to create offering specifically for each customer.

Get the facts

In stores, interactions with intelligent automation will become the norm in a few years. The technology is already helping retailers improve in-store shopping by using data to ensure that the right products in the right sizes are in the right stores. It does so by allowing retailers to look through reams of data and spot new developments or emerging trends that would be impossible for a human to pick up on.

Of course, this is not just about machines and software. Bindu Thota, vice president of technology at online retailer Zulily and part of a panel that discussed the NRF/IBM report at NRF 2019, said her company uses intelligent automation as part of a daily personalization process that “serves up the right message at the right time on the right channel” in a merging of art and science.

81 percent of retail executives surveyed expect to retrain employees in functional areas impacted by automation.

There is no doubt that intelligent automation will change how some people work. According to the study, 81 percent of retail executives surveyed expect to retrain employees in functional areas impacted by automation. That includes training associates to focus more on customer experience while moving them away from routine activities like stocking shelves or taking inventory. In other cases, it means training inventory planners in how to use intelligent automation tools to allocate merchandise more effectively. As we move into the future of technology-enhanced retail, retail employees will retain a critical role in delivering a high-quality customer experience to consumers everywhere.

To discover more about how intelligent automation will revolutionize retail, explore the full study from NRF and IBM: “The Coming AI Revolution in Retail and Consumer Products”.


POS Data Analysis: A Crash Course

POS Data AnalysisThink that your Point-of-Sale (POS) System is ‘just a cash register’ that doesn’t contribute to driving innovation in your business?

That is a HUGE myth. But you’re not alone. Perhaps you’ve yet to discover all the ways to leverage your POS data; if that’s the case, your business has been missing out in so many ways.

The data that your POS system collects during every transaction is a gold mine in terms of being incredibly useful in improving your business. This data is, like gold, a valuable set of tools for merchants wishing to optimize their business; however, many business owners don’t know where to begin when it comes to how to analyze the copious amounts of information they’re faced with.

Keep reading for your crash course on POS data and what wonderful, advantageous things you can do with it.

What is POS Data?

Your Point of Sale system, as mentioned above, is a wealth of information that tracks your inventory levels, units sold, and dollars earned – but that’s just the beginning. Nearly all retailers use POS, both brick and mortar, as well as online stores.

The information within your POS system includes business insight data – such as Inventory Status and Business Management, and customer insight data – such as who is buying, why they are buying, what they prefer to buy, when they buy, where they buy (online, offline or in which stores) and a lot more useful data relating to customers.

POS systems can hold a lot of data. Now, POS can be used digitally or through traditional means. For example, you could use a source such as POS Paper, which has a wide range thermal paper rolls you can use for your POS systems. There’s a number of different POS rolls to choose from. Every POS system is different and has varying features, benefits, and needs.

Let’s get back to the data though. Here’s what you should be asking: How much farther can this data take my business?

Why analyze POS Data?

Every day, POS terminals collect vast quantities of data; however, this data is raw, a form in which it’s minimally useful to you. All of this gathered data needs to be funneled into one place, where it can be validated and organized so that you may pull up specific insightful reports using said data. The goal is maximum utility of your data. In its final form, POS data can help you track and forecast your stock counts, optimize your marketing campaigns, give you a better understanding of your customers’ needs and much more.

Basic POS Data Analysis

Point of Sale Data AnalysisInventory Reporting and Analysis

Imagine this scenario: You’re selling a lot of product but not seeing profit. Why?
Well, there’s a good chance that your inventory data isn’t serving you as well as it could. However, you could easily track the inventory status with a single click.
One of our most-used reports is the Product-to-Date Report, which shows sales-to-stock ratios and weeks-of-supply with on-hand and on-order inventory levels. In-stock percentages, turns and average units and dollars are also displayed.

To avoid the mistake in ordering out-of-stock products, the POS system will automatically update stocks in real time and hide unavailable items for online customers. The system also instantly notifies your sales staff if the number of items added to cart is higher than the available quantity in the selected warehouse.

Unsurprisingly, one of retail’s largest concerns for 2019 is improving the customer experience. Knowing exactly what you have on hand, in transit, on order and on the shelf is key to achieving the satisfying customer experience.

Multi-retailer data analysis

With our Geographic Store Across Retailers Report, you can look at product-level performance across geography and across retailers. Try answering these questions without access to this report:
What and where is your customer buying?
What sells better at each retailer? How did recent product launches or promotions go? What is your product inventory spread across retailers?

These questions are laborious and time-consuming to answer manually, but this point of sale report provides all your retail analytics and is specially built to gain a better internal analysis of your business in real time.

POS Data AnalysisSales Trends and KPIs

In addition to specific sales and inventory levels at each store, the Store Sales Data Report shows the number of active stores, weeks selling in stores, sell-through, sales-to-stock ratios, weeks of supply and turn. With flexible date ranges, this data report is a great snapshot of store (and online) performance with year-over-year comparisons. The report helps identify top- and bottom-performing stores and their contribution to total sales within a retailer. Cross-retailer views also allow for competitive analysis for stores that are in the same geographical area.
Additionally, the KPI Report provides a quick snapshot of your key performance indicators on one report. You can easily see if each KPI is up, down, or flat. This report is easily viewed, exported and shared, even on mobile; what’s more, we can add your sales plan in order to convey performance vs. plan.

Returns, Exchanges and Refunds

Merchandise returns resulted in $351 billion in lost sales in the U.S. in 2017, according to a report from Appriss Retail. For context, the US national debt was around $400 billion during that time.

While product returns are probably one of the most undesirable facets of business, they’re pretty much unavoidable. But even these can contribute valuable data to help you gain significant insights into your customers’ wants and needs.

Regularly monitoring these activities can reveal a variety of trends. Pay attention to any specific trends involving returned products. Dig deeper. Are the products defective? Does the item simply not meet customers’ expectations?

What type of refund do customers typically prefer? Most POS systems allow merchants to refund past orders to the original payment method or make exchanges for store credit. Whether customers take the store credit option or simply want their money back can affect your bottom line.

This kind of POS data analysis can help you make small changes, like eliminating certain products from your shelves, that could make a big impact on your revenues, but this gets more complicated when it comes to transforming to an omnichannel model. Businesses utilizing POS data analysis tools to help track and manage inventory levels in stores and fulfillment centers can work with their retailer buyers to optimize their working capital investments in inventory and partner with them to create a better customer experience and reduce their lost sales opportunities. Read more about omnichannel here.

 POS Data ReportingROI

As you can see, the amount of data gathered by your point of sale system is staggering. Typically, the manual process of gathering this data, sorting it out and putting it into comprehensive reports is exhaustively long. Not only are you paying more for people to gather the POS data and create the reports, by the time you get them in-hand they’re yesterday’s news! We automate all of these steps so that all your POS reports can be retrieved with a single click, saving time, money and energy and ultimately boosting your bottom line.

The Future of Retail Forecasting: Quality over Quantity in 2019

CPFR

Work Smarter

In 2019, even the most traditional retailers are realizing that the key to a successful retail strategy in today’s market is the collection, analysis and implementation of data.
When we talk about data, we’re not saying that you should be amassing every last bit you can get your hands on – we’re talking about smart data – data that works for you. To reiterate, it’s not necessarily more data you want; rather, high-quality, relevant, consumer-driven data is what you should shoot for.

“The question is…between more data and better data,” Josh Krepon, Cole Haan’s SVP of digital commerce, elucidated at a recent event.

Data Then…

Often, most of the massive quantities of data available to brands is, sadly, inaccurate or low-quality, or is overly laborious and time-consuming to organize and compile, much less read and analyze.
While it’s easy to become overwhelmed by all the data available to you, between current trends, social analytics, new technologies, and more, you don’t have to end up down a rabbit hole, elbow-deep in numbers and figures that don’t help you to form a cohesive picture of any real value.

…and data now.

While traditional methods of data collection are more or less statistical, the latest approaches involve automation, machine learning (yes, AI), and direct feedback from the consumer themselves.
Brands know that user-generated content can be super beneficial, as it’s essentially straight from the source. Due to the perceived reliability of direct customer feedback, brands rely on this information to inform decision-making.
Consumers who actively participate in giving feedback provide the company with millions of precise and practical data points. Great – but then you face the staggering amount of time it will take to comb through, validate, clean, and compile these data points into a usable report.
Having access to useful, reliable data analytic tools can save a huge amount of time and money, allow marketers to streamline their strategies, and improve the customer experience.

CPFR
Accelerated Analytics is a software-as-a-service, aggregating your relevant data and automatically validating, cleansing, and organizing it into comprehensive reports that you can access with a minimum number of clicks. No more slaving for hours or days over spreadsheets to try to keep your head above water. We can help you get and stay ahead of the curve – your competition won’t know what hit them!


Contact us for more info  |  (941) 746-2073

9135 58th Drive E Bradenton, FL 34202

Accelerated Analytics’ Home Depot Customers Win in Q3

POS Reporting

Accelerated Analytics customers who sell into Home Depot once again outpaced results for year over year US comp sales. Home Depot reported a 5.4% increase in year over year US sales comps for the quarter, as part of 5.1% overall sales increase over Q3 2017. Accelerated Analytics customers grew an average of 5.9%, topping The Home Depot overall.

The Home Depot also reported top performing department trends included appliances, electrical, plumbing, tools, decor and flooring. Every one of these departments are represented in Accelerated Analytics’ customer base. Customers use our Power Pack of reporting tools to control out of stocks, deal with weather trends and prepare for line reviews. On top of tracking point of sale activity, they are some of the strongest partners with their retailers.

AcceleratedAnalytics.com

Follow our page on LinkedIn!


Help Tampa Children Fighting Cancer and Spending Holidays in the Hospital


The Sadie Keller Foundation collects thousands of toy gifts to share with these special children every year.

An Amazon gift wish list created specifically for Tampa children can be found HERE.

Please consider purchasing toys and helping to make their holiday special. Sadie’s goal is 1000 toys in Tampa!

Watch Sadie’s video to learn more about Sadie’s Sleigh and our efforts in the Tampa area.


Accelerated Analytics Sponsors HIRI Conference in Chicago

Accelerated Analytics was pleased to be a repeat-sponsor of the Home Improvement Research Institute (HIRI) event on September 18 and 19. The 2018 Insights Conference hosted many DIY, home and hardware vendors and retailers to discuss key economic indicators, trends and forecasts for this division of the retail industry. Topics included global economic impacts on the home improvement market, trends in remodeling and home building, and the evolving healthy home range of products coming to market. The conference was held at the historic McDonald’s Hamburger University in Oak Brook, IL. Accelerated Analytics was the only POS analytics reporting solution provider at the event, and welcomed many current and newly-signed DIY vendor customers. Many attended a dinner hosted by Accelerated Analytics CEO, Chad Symens, and Director of Sales and Marketing, Jennifer Freyer, at Wildfire in Oak Brooke.

POS Reporting Provider

Accelerated Analytics Develops Future Data Scientists


Retail Analytics Leader Works with School

Students from Florida Polytechnic University will be undertaking two Capstone projects with Accelerated Analytics in 2018-19. The students involved are studying Data Science, Computer Science and Information Technology, and the projects are part of the Senior Design program. Both projects involve Data Aggregation and Machine Learning.

Accelerated Analytics is very proud to work with this talented group of students.  FPU selected ten projects for Data Science/Business Analytics, and two of those are working with Accelerated Analytics. Forbes magazine predicted that demand for these job roles will spike by 28% by 2020. Data Science and Analyst jobs are among the most challenging to fill, taking five days longer to find qualified candidates than the market average. As thought leaders in retail analytics, Accelerated Analytics is committed to contributing to the education of future experts in their industry. Careers at Accelerated Analytics can be found on their web site.