Tag: The Home Depot

Accelerated Analytics’ Home Depot Customers Win in Q3

POS Reporting

Accelerated Analytics customers who sell into Home Depot once again outpaced results for year over year US comp sales. Home Depot reported a 5.4% increase in year over year US sales comps for the quarter, as part of 5.1% overall sales increase over Q3 2017. Accelerated Analytics customers grew an average of 5.9%, topping The Home Depot overall.

The Home Depot also reported top performing department trends included appliances, electrical, plumbing, tools, decor and flooring. Every one of these departments are represented in Accelerated Analytics’ customer base. Customers use our Power Pack of reporting tools to control out of stocks, deal with weather trends and prepare for line reviews. On top of tracking point of sale activity, they are some of the strongest partners with their retailers.

AcceleratedAnalytics.com

Follow our page on LinkedIn!


Our Power Packs Go Beyond What Comes in Free Portals

With 15 years in the DIY sales and inventory reporting business, and over 50 years of retail experience, Accelerated Analytics offers “Power Packs” of reports expertly crafted for home and hardware brands. Our reports provide instant access to key performance indicators and measures that brands need to monitor results and drive business success at The Home Depot POS Reporting Solutionsand Lowe’s. Brands are able to obtain some information directly from the retailers’ portals, so you may be asking what our consultative reports have that the free portals don’t. Easier to use, with greater flexibility and more robust data, our reports can be leveraged to improve sales comps and optimize inventory.

While brands can use the free retailer portals, the process of managing that data each week still presents challenges:

  • Extraction from each portal is manual, separate and difficult to merge into spreadsheets, and can take several days to get together, losing valuable time to take action on last week’s results
  • Retailer-specific SKUs need to be cross referenced to each other and to internal brand SKUs
  • Store information, product descriptions and attributes, comps and calendaring need manual manipulation or are not incorporated at all
  • Distribution to teams is manual, difficult and time consuming
  • Actionable insights are not readily called out, such as out of stocks or lost sales opportunities

Take a look at a side-by-side comparison of Home Depot Link, Lowe’s DART and Accelerated Analytics for more details on what our robust “Power Pack” of reports can provide!

Accelerated Analytics Customers Outperform Home Depot LY/TY Comps Again

Customers Outperform Rest of Brands in The Home DepotAccelerated Analytics customers who sell their products at The Home Depot saw their third quarter comp sales increase 9.2% over last year! That surpasses the results reported by The Home Depot in their recently released third quarter results. In a blog post on November 15th, we shared The Home Depot’s Q3 results which included reported sales of $25.0 billion, and comparable store sales for the third quarter of fiscal 2017 of positive 7.9 percent.

DIY, Home and Hardware vendors count on Accelerated Analytics to provide an expert reporting solution that empowers their sales, marketing and store operations teams. Our product and store level analytics provides the insights needed to exceed sales goals, increase orders to fully stock their shelves, test plan-o-gram efficiencies, and prepare for line reviews.

Our customers truly are winning at retail because we understand the home improvement retail business inside and out and provide a solution that is specifically targeted to, and designed for, a DIY vendor.

Kidde & The Home Depot to Distribute Smoke Alarms Across the Country

Where there’s smoke, there’s smoke detectors. At least, that’s the goal.

Few people think about fires until they experience one themselves. But more people report fires than you probably think: approximately one in 338 households each year. That’s more than 360,000 homes.

What’s more: three out of five home fire deaths happen in homes without working smoke alarms.*

Kidde and The Home DepotAccelerated Analytics customer Kidde and The Home Depot are helping to prevent that. Through Operation Save a Life, The Home Depot partners with Kidde and local fire departments to distribute thousands of smoke and carbon dioxide alarms in communities across the country each year. Since 2002, Operation Save a Life has provided more than 1.36 million smoke alarms in 15 communities.

“A working smoke alarm almost doubles your chance of escaping a fire without injury or death,” said Sharon Cooksey, marketing communications manager for Kidde. “Our mission is to save and protect. Installing a smoke alarm is the first step in doing that.”

Learn more about Kidde HERE and download our Kidde Case Study HERE.

Source: HomeDepot.com

Accelerated Analytics Customers Excelling at The Home Depot

Accelerated Analytics customers who sell their products at The Home Depot saw their first quarter comp sales increase 12% over last year! That’s double the results reported by The Home Depot when they released their first quarter results last month. In a news release on May 16th, The Home Depot reported sales of $23.9 billion for the first quarter of fiscal 2017, a 4.9 percent increase from the first quarter of fiscal 2016. Comparable store sales for the first quarter of fiscal 2017 were positive 5.5 percent, and comp sales for U.S. stores were positive 6.0 percent.

DIY, Home and Hardware vendors count on Accelerated Analytics to provide an expert reporting solution that empowers their sales, marketing and store operations teams. Our product and store level analytics provides the insights needed to exceed sales goals, increase orders to fully stock their shelves, test plan-o-gram efficiencies, and prepare for line reviews.

Our customers truly are winning at retail because we understand the home improvement retail business inside and out and provide a solution that is specifically targeted to, and designed for, a DIY vendor.

DIY Retailers Bloom Into Spring

DIY Retailers Home Depot

Barron’s reported on Sunday that home improvement retailers The Home Depot and Lowe’s are strongly positioned financially going into Spring. Homeowners are undertaking renovations and projects due to a healthier economy and improved real estate markets. Barron’s also states that The Home Depot and Lowe’s are “Amazon-proof” as home improvement is low on the list of categories Amazon is penetrating.

The Home Depot has out-performed Lowe’s over the last several quarters in same-store performance, but Lowe’s is attractive to investors for its lower price-to-earnings ratio. Both retailers are expected to see revenue and stock price increases.

Lowe’s trades at $82, 18 times its $4.62 earnings per share, while The Home Depot trades at $147, 20.4 times its earnings of $7.19 per share.

Accelerated Analytics provides POS reporting and analysis for dozens of DIY vendors who sell through home improvement retailers, reporting on over $11B in sales per year in this segment alone. DIY vendors can learn more about our expert solutions for DIY, home and hardware vendors on our new website solutions pages.

Source: Reuters.com

DATA-DRIVEN Series: What You Can Learn From Your Average Retail Selling Price

Data Analysis

Last week, I had the opportunity to work with two different customers analyzing their sales at The Home Depot.  One sells products in the paint department and the other sells into the building materials department.  The analysis goal for both customer projects was to deconstruct their YTD sales and identify the factors contributing to higher than expected comp sales increases.  Both customer’s sales for a set of key SKU’s were up about 2.5% YoY and the question they wanted answered was, “What is driving the higher sales, and will it continue?”

Average Retail Price
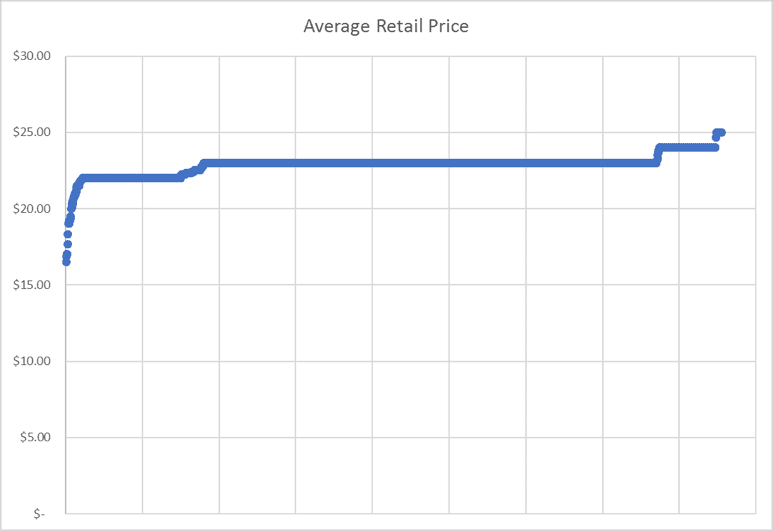
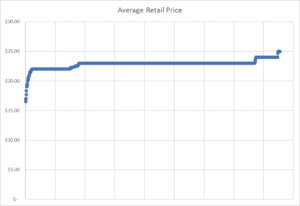
As we deconstructed their respective sales into its component parts of distribution, price, and rate of sale, we uncovered interesting data regarding average retail selling price.  The first customer’s average retail price was pretty consistent across Home Depot stores at the expected $22.95 retail price.  There were some fluctuations, but the data was pretty clustered, as expected.


In contrast, the second customer’s average retail price was very inconsistent.  Customer #2 believed that The Home Depot was pricing their core SKU at $59.95 or $65.95, depending on the market.  However, as you can see in Figure 2, the pricing was very inconsistent across stores.  In fact, we identified stores in the same Home Depot market with a selling price variance of $28.35 per unit.

Home Depot EDI

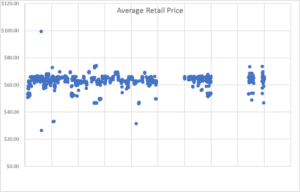
While there can be good reasons to price a product differently by market due to shipping costs or competitive pressures, it seems irregular to have different prices within the same market.  Take a look at the average retail price of your products. It’s an important exercise that can yield some interesting insights.  It presents an opportunity to have a conversation with your merchant about pricing strategies.  And, It also provides an opportunity to identify markets with similar demographic profiles, but different selling prices, thus providing insight into what price point drives the highest sales.

Does your average selling price match your expectations?  The answer may not be as simple as you think and could reveal some interesting insights.

Home Depot EDI