Tag: POS Data

Client Spotlight: Vera Bradley

Vera Bradley Capitalizes on Opportunities by Leveraging POS DataVera Bradley POS Data Reports

In 2013, when the business leaders at Vera Bradley were bringing on Dillard’s, their first big department store, they knew it would be critically important to be able to see their sell-through. When they asked the team at Dillard’s for sell-through data, Dillard’s quickly introduced Vera Bradley to Accelerated Analytics and a strong and valuable relationship began. As Vera Bradley expanded into additional department stores, Accelerated Analytics was with them every step of the way.

Challenges

As Vera Bradley expanded into new retailers, they knew that one of the keys to their successful growth would be the ability to compare sales across retailers. Relying solely on each individual retailer for sales data would mean looking at multiple reports with inconsistent formats and verbiage. Deriving the comparisons and analysis that would be essential to the success of their growth strategy would be time consuming and challenging. Accelerated Analytics provided a solution that allowed Vera Bradley to see all of their sales data across retailers, in a consistent format.

“We can react quickly because we have visibility; patterns are emotional and numbers don’t lie.”
– Heidi McClain, Business Planner, Vera Bradley

Vera Bradley Utilizes POS ReportingData Visibility Empowers Vera Bradley to Make Timely, Informed Decisions

From the business planners to the account managers and sales team, multiple departments use our POS reports and analysis provided to Vera Bradley by Accelerated Analytics. Business Planner Heidi McClain values the ability to see the “store and SKU attributes how we want to see them as opposed to how the retailer provides them.” She explains that the SKU-level sales versus top-level sales “speak volumes to our account managers.” McClain provides a weekly selling summary to the sales team, enabling them to compare sales across retailers, identify strengths and opportunities, and react quickly. Vera Bradley’s Director of Information Architecture says that Accelerated Analytics is “like having an extension of my team,” and points to the value of the sell-through data as one of the most valuable aspects of the Accelerated Analytics tool. Accelerated Analytics data and reports empower the Vera Bradley team with the knowledge of what’s selling and what’s not, and enables them to react quickly.

• In 2015 when Vera Bradley launched new doors with one of their existing department stores, from day one they were able to identify opportunities in current inventory and quickly partner with them to make adjustments.

• When the Vera Bradley team needs to know how an account is performing they can view its success geographically and easily see its percent to total.

• When one of their department store partners passed on a top pattern, Accelerated Analytics data helped show Vera Bradley how well the pattern was performing within other retail partners. That gave the store the confidence to add it to their assortment. Since adding it, this retailer’s sales have continued to increase and the pattern is one of their top performers to date.


About Vera Bradley Guided by their founders, Patricia R. Miller and Barbara Bradley Baekgaard, Vera Bradley has earned a reputation as a leader in the gift industry. Creating stylish quilted cotton luggage, handbags and accessories, the company combines smart product designs with distinctive and colorful fabrics and trims.

POS Data Analysis: A Crash Course

POS Data AnalysisThink that your Point-of-Sale (POS) System is ‘just a cash register’ that doesn’t contribute to driving innovation in your business?

That is a HUGE myth. But you’re not alone. Perhaps you’ve yet to discover all the ways to leverage your POS data; if that’s the case, your business has been missing out in so many ways.

The data that your POS system collects during every transaction is a gold mine in terms of being incredibly useful in improving your business. This data is, like gold, a valuable set of tools for merchants wishing to optimize their business; however, many business owners don’t know where to begin when it comes to how to analyze the copious amounts of information they’re faced with.

Keep reading for your crash course on POS data and what wonderful, advantageous things you can do with it.

What is POS Data?

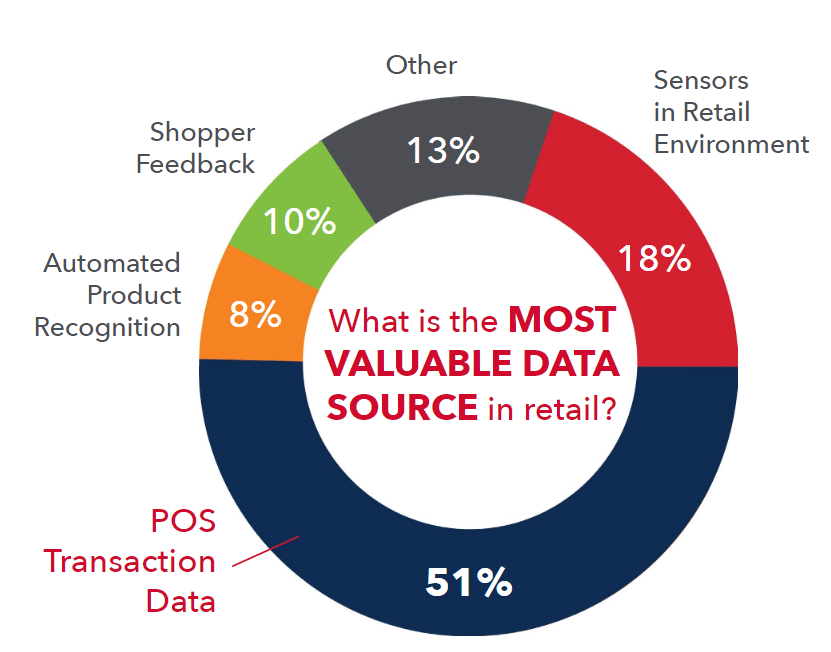
Your Point of Sale system, as mentioned above, is a wealth of information that tracks your inventory levels, units sold, and dollars earned – but that’s just the beginning. Nearly all retailers use POS, both brick and mortar, as well as online stores.

The information within your POS system includes business insight data – such as Inventory Status and Business Management, and customer insight data – such as who is buying, why they are buying, what they prefer to buy, when they buy, where they buy (online, offline or in which stores) and a lot more useful data relating to customers.

POS systems can hold a lot of data. Now, POS can be used digitally or through traditional means. For example, you could use a source such as POS Paper, which has a wide range thermal paper rolls you can use for your POS systems. There’s a number of different POS rolls to choose from. Every POS system is different and has varying features, benefits, and needs.

Let’s get back to the data though. Here’s what you should be asking: How much farther can this data take my business?

Why analyze POS Data?

Every day, POS terminals collect vast quantities of data; however, this data is raw, a form in which it’s minimally useful to you. All of this gathered data needs to be funneled into one place, where it can be validated and organized so that you may pull up specific insightful reports using said data. The goal is maximum utility of your data. In its final form, POS data can help you track and forecast your stock counts, optimize your marketing campaigns, give you a better understanding of your customers’ needs and much more.

Basic POS Data Analysis

Point of Sale Data AnalysisInventory Reporting and Analysis

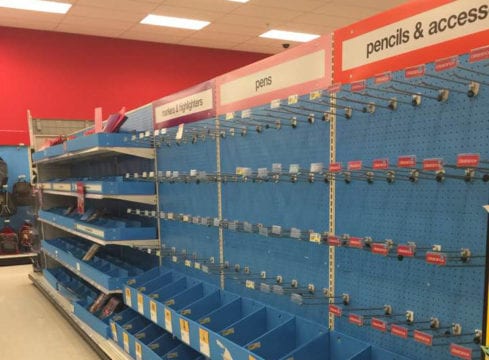
Imagine this scenario: You’re selling a lot of product but not seeing profit. Why?
Well, there’s a good chance that your inventory data isn’t serving you as well as it could. However, you could easily track the inventory status with a single click.
One of our most-used reports is the Product-to-Date Report, which shows sales-to-stock ratios and weeks-of-supply with on-hand and on-order inventory levels. In-stock percentages, turns and average units and dollars are also displayed.

To avoid the mistake in ordering out-of-stock products, the POS system will automatically update stocks in real time and hide unavailable items for online customers. The system also instantly notifies your sales staff if the number of items added to cart is higher than the available quantity in the selected warehouse.

Unsurprisingly, one of retail’s largest concerns for 2019 is improving the customer experience. Knowing exactly what you have on hand, in transit, on order and on the shelf is key to achieving the satisfying customer experience.

Multi-retailer data analysis

With our Geographic Store Across Retailers Report, you can look at product-level performance across geography and across retailers. Try answering these questions without access to this report:
What and where is your customer buying?
What sells better at each retailer? How did recent product launches or promotions go? What is your product inventory spread across retailers?

These questions are laborious and time-consuming to answer manually, but this point of sale report provides all your retail analytics and is specially built to gain a better internal analysis of your business in real time.

POS Data AnalysisSales Trends and KPIs

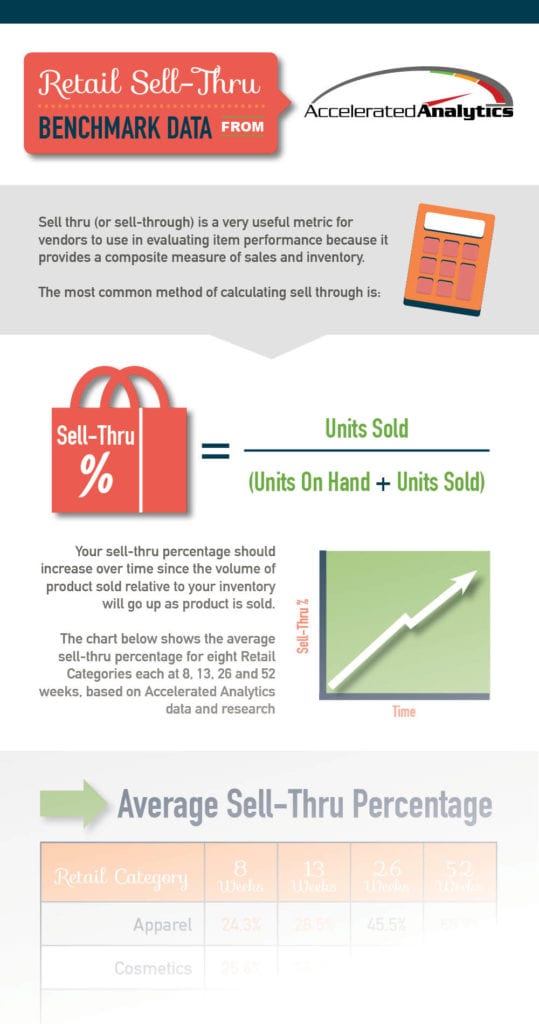
In addition to specific sales and inventory levels at each store, the Store Sales Data Report shows the number of active stores, weeks selling in stores, sell-through, sales-to-stock ratios, weeks of supply and turn. With flexible date ranges, this data report is a great snapshot of store (and online) performance with year-over-year comparisons. The report helps identify top- and bottom-performing stores and their contribution to total sales within a retailer. Cross-retailer views also allow for competitive analysis for stores that are in the same geographical area.
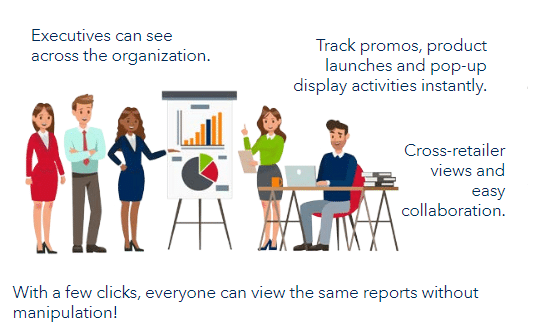
Additionally, the KPI Report provides a quick snapshot of your key performance indicators on one report. You can easily see if each KPI is up, down, or flat. This report is easily viewed, exported and shared, even on mobile; what’s more, we can add your sales plan in order to convey performance vs. plan.

Returns, Exchanges and Refunds

Merchandise returns resulted in $351 billion in lost sales in the U.S. in 2017, according to a report from Appriss Retail. For context, the US national debt was around $400 billion during that time.

While product returns are probably one of the most undesirable facets of business, they’re pretty much unavoidable. But even these can contribute valuable data to help you gain significant insights into your customers’ wants and needs.

Regularly monitoring these activities can reveal a variety of trends. Pay attention to any specific trends involving returned products. Dig deeper. Are the products defective? Does the item simply not meet customers’ expectations?

What type of refund do customers typically prefer? Most POS systems allow merchants to refund past orders to the original payment method or make exchanges for store credit. Whether customers take the store credit option or simply want their money back can affect your bottom line.

This kind of POS data analysis can help you make small changes, like eliminating certain products from your shelves, that could make a big impact on your revenues, but this gets more complicated when it comes to transforming to an omnichannel model. Businesses utilizing POS data analysis tools to help track and manage inventory levels in stores and fulfillment centers can work with their retailer buyers to optimize their working capital investments in inventory and partner with them to create a better customer experience and reduce their lost sales opportunities. Read more about omnichannel here.

 POS Data ReportingROI

As you can see, the amount of data gathered by your point of sale system is staggering. Typically, the manual process of gathering this data, sorting it out and putting it into comprehensive reports is exhaustively long. Not only are you paying more for people to gather the POS data and create the reports, by the time you get them in-hand they’re yesterday’s news! We automate all of these steps so that all your POS reports can be retrieved with a single click, saving time, money and energy and ultimately boosting your bottom line.
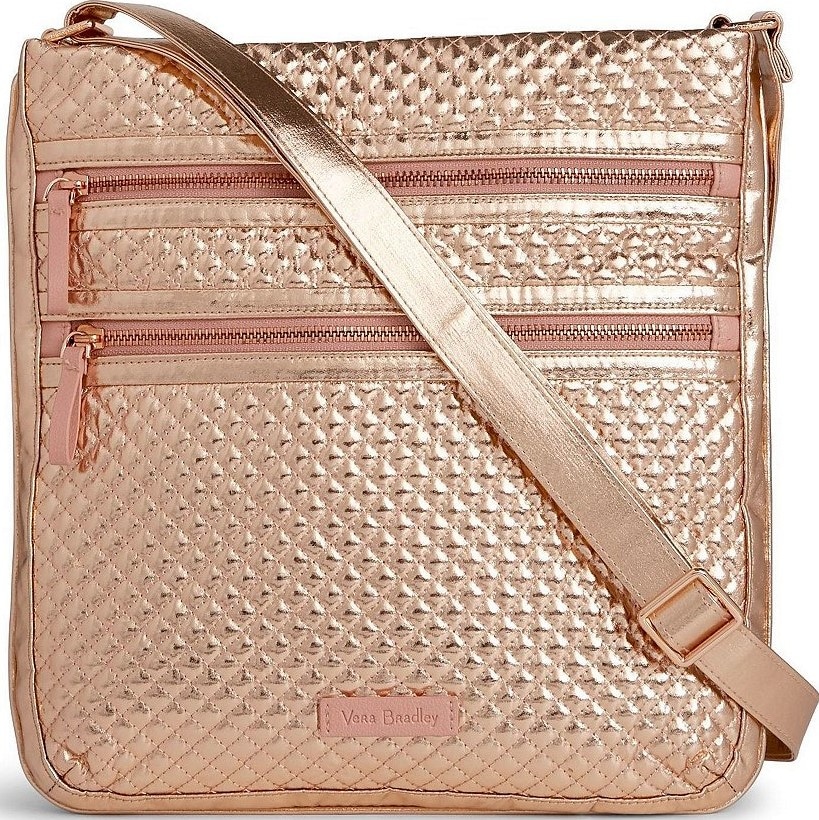
Reducing Out of Stocks

Probably three of the ugliest words for a retailer or vendor are — out of stock. Each and every time an out of stock (OOS) occurs, the retailer, vendor, and consumer lose. Revenues and profitability go down, and consumer frustration rises. This is not a newsflash; it’s easy to find a wealth of OOS research with a simple Google search. Thought leaders in the retail industry have been writing articles and funding research for decades to quantify the magnitude of the problem, diagnose root causes, and create solutions. The net benefit of all this work? Drum-roll please…. average OOS rates are holding steady at about 8% on average, with out of stocks for promoted items often exceeding 10%.

Out of Stock AnalysisAccording to a 2015 FMI/GMA Trading Partner Alliance Report, the problem is compounded by the growing importance of the user experience. Product availability is one of the top three reasons for where they shop, but during every shopping experience, one out of every 12 items on the shoppers list is not on the shelf. Additional data from the Grocery Manufacturers of America (GMA) and the Food Marketing Institute (FMI) Trading Partner Alliance shows an unsettling three-strikes-and-you’re-out pattern. A typical shopper will substitute another item on the first occurrence of an out-of-stock 70 percent of the time; on the second occurrence the shopper is equally likely to substitute, make no purchase, or go to another store; and on the third occurrence, 70 percent will go to another store. In addition to the potential for lost revenue from the out-of-stock item itself, there is also the potential for loss of future revenue streams from lost brand and/or store loyalty.

I recently had an opportunity working with a customer to help them quantify the impact out of stocks were having on their sales. We developed a Lost Dollars sold report which calculates the dollars lost by week for a SKU across all the stores at their largest retail customer.  The report is pretty simple – it identifies every out of stock for a period of time, in this case the most recent four weeks, and then calculates the average rate of sale by store.  Since the average unit retail price is known, we can calculate the estimated sales lost by looking at the units which would have been sold had the product been in stock, and multiply that number by the average unit price. The customer I was working with was shocked to see that out of stocks at their largest retail customer was costing them a little over $3,500 per week.  That added up to about $14,000 for the four-week period we analyzed. The customer took our report to their replenishment manager, along with a recommendation to place an order sufficient to cover the next eight weeks of expected demand.  The end result was an increase in sales of 3.5%!

We often have conversations with customers where they cite an in-stock rate of 99%. But, when you’re out of stock 1% of the time, the financial impact can add up quickly.  The customer I referenced above was running at 99.1% in stock, and we still increased their sales!

Reducing out of stocks is a complex problem, with many moving parts and multiple parties that have to execute in harmony, or the entire system breaks down. But, you can’t manage and improve what you are not measuring. And it’s hard to believe a vendor is making an effort to reduce OOS if they are not measuring on-hand at their retail customers. If you are a vendor dependent on a retailer maintaining good shelf availability to grow your sales, then you need to proactively manage in-stock. That means, if your retailer makes POS activity available at midnight Sunday, your team should be taking action by 11:00 am Monday morning. Not just loading data into a spreadsheet, so they can start the analysis process. Or worse yet, not even receiving any data at all. Timely reporting and analysis on your in-stock and out-of-stock data across your retailers is a proactive step toward battling that steady, average out of stock rate of 8%.

For additional information, download out whitepaper titled Out of Stock Analysis available in the resource center.

Calculating the cost of out of stock’s

Vendors know an out of stock or empty peg is a very bad thing, so it’s hard to understand why most vendors are not managing their retail sales at a store and item level. Here is what we calculated for a vendor this week to estimate their lost sales due to out of stocks. The results were pretty eye opening.

This vendor has 4 retail customers. Retailer 1 has 3,600 stores, retailer 2 has 2,500 stores, retailer 3 has 1,800 stores and retailer 4 has 950 stores. Total retail stores = 8,850. Average in-stock % across all four retailers = 98% so approximately 177 stores are out of stock each week. Weekly unit sales for their top selling items average 6 per week so approximately 1,062 unit sales are being lost each week, which is roughly $15,000 in lost sales per week.

In other words this vendor is loosing over $750,000 per year in sales.

Calculating Sell-Thru

Retail Sell-Thru

Sell through (or sell-thru) is a very useful metric for vendors to use in evaluating item performance, because it provides a composite measure of sales and inventory. But like many business measures, there is more than one method of calculating sell through.

The most common calculation is: Sell Thru % = Units Sold / (Units On-Hand + Units Sold). Sell thru is typically evaluated on a daily basis for fast moving products or weekly for slower moving or replenishment based products.  A higher value is better, indicating your sales velocity is good and your inventory is appropriately forecasted. If sell thru is low, this indicates either poor sales or too much inventory. In most cases, sell-thru for an item is compared in recent periods like current week and last week, as well as in aggregate across several months or even a year.

When evaluating sell-thru, it is also useful to group together products which have been selling for a similar period of time and/or which are sold into the similar store types. For example, comparing sell-thru for a product with 5 weeks of selling activity against a product with 20 weeks of selling activity most likely will not produce a useful comparison. In the same way, comparing sell-thru for a product in a group of stores in a highly affluent area is not likely to compare favorably to a group of stores with a low income level.

Most retail buyers have a set sell-thru percentage they use to judge vendors based on product category or department.  It is important for vendors to discuss the sell-thru expectations with the buyer in order to align with those objectives.

For reference, we’ve compiled sell-thru percentage data that you can use as a benchmark.