Author: Chad Symens

Small Business Optimism Remains Near Record High

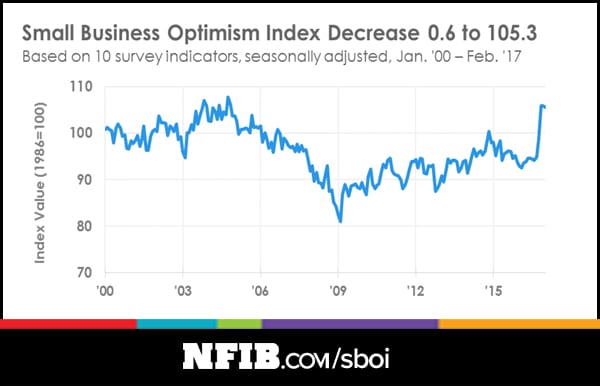
Small Business Optimism IndexEach month as our team researches and compiles the Retail Industry Briefing Book, different facts and figures stand out, and we inevitably notice trends and patterns in the data we report. Notable this month was the number of macro-economic indexes that are currently on an upward trend, and the 90-day temperature outlook, which was certainly appealing as a large portion of the country was in the midst of a snow-storm this week. But it’s the Small Business Optimism Index that deserves some discussion as we head into the second quarter of 2017.

Compiled since 1986 by the National Federation of Independent Businesses (NFIB) via a monthly survey, the Small Business Optimism Index remained at one of its highest readings in 43 years February, as small business awaits new healthcare law, tax reform, and regulatory relief form Washington, according to the NFIB. The index fell 0.6 points in February to 105.3, yet remains very high. The slight decline follows the largest month-over-month increase in the survey’s history in December, and another increase in January.

“It is clear from our data that optimism skyrocketed after the election because small business owners anticipated a change in policy,” said NFIB President and CEO Juanita Duggan. “The sustainability of this surge and whether it will lead to actual economic growth depends on Washington’s ability to deliver on the agenda that small business voted for in November. If the health care and tax policy discussions continue without action, optimism will fade.”

To Duggan’s point, the post-election optimism hasn’t translated into an increase in business spending and hiring yet. Despite some movement in Washington on deregulation and the current administration’s plan to repeal and replace the Affordable Care Act, small businesses want to see more progress on both tax reform and healthcare, according to NFIB Chief Economist William Dunkleberg.

The job openings component reached its highest level since December 2000, but finding skilled workers remains a top issue for 44 percent of businesses, which report few or no qualified workers to fill positions. Also notable, capital spending among small business owners rose two points to 62 percent. This is the second highest reading since 2007, indicative that companies may be starting to invest.Business Reports
Accelerated Analytics reports on the Small Business Optimism index each month in our Retail Industry Briefing Book (page 14 of the March edition), in addition to over a dozen macro-economic indicators and indexes. You’ll also find stock prices for over 30 major retail brands and retailers, retail sales by sector, weather outlooks and more. The RIBB is a free resource provided to our customers, partners and retail and supply chain professionals. To request the latest copy of the RIBB, simply complete the short form below. Past editions of the RIBB can be found in the Resource Center of our website.
Reducing Out of Stocks

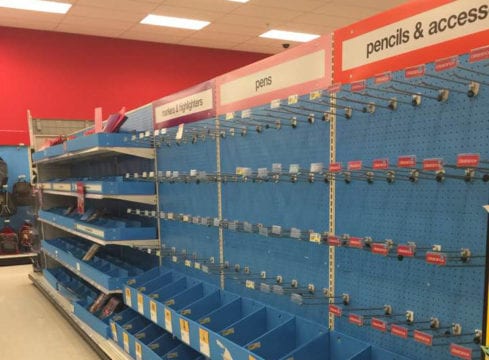
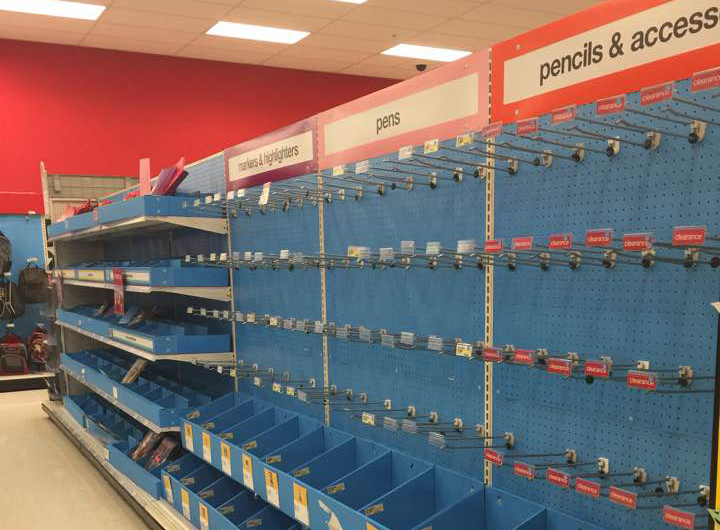
Probably three of the ugliest words for a retailer or vendor are — out of stock. Each and every time an out of stock (OOS) occurs, the retailer, vendor, and consumer lose. Revenues and profitability go down, and consumer frustration rises. This is not a newsflash; it’s easy to find a wealth of OOS research with a simple Google search. Thought leaders in the retail industry have been writing articles and funding research for decades to quantify the magnitude of the problem, diagnose root causes, and create solutions. The net benefit of all this work? Drum-roll please…. average OOS rates are holding steady at about 8% on average, with out of stocks for promoted items often exceeding 10%.

Out of Stock AnalysisAccording to a 2015 FMI/GMA Trading Partner Alliance Report, the problem is compounded by the growing importance of the user experience. Product availability is one of the top three reasons for where they shop, but during every shopping experience, one out of every 12 items on the shoppers list is not on the shelf. Additional data from the Grocery Manufacturers of America (GMA) and the Food Marketing Institute (FMI) Trading Partner Alliance shows an unsettling three-strikes-and-you’re-out pattern. A typical shopper will substitute another item on the first occurrence of an out-of-stock 70 percent of the time; on the second occurrence the shopper is equally likely to substitute, make no purchase, or go to another store; and on the third occurrence, 70 percent will go to another store. In addition to the potential for lost revenue from the out-of-stock item itself, there is also the potential for loss of future revenue streams from lost brand and/or store loyalty.

I recently had an opportunity working with a customer to help them quantify the impact out of stocks were having on their sales. We developed a Lost Dollars sold report which calculates the dollars lost by week for a SKU across all the stores at their largest retail customer.  The report is pretty simple – it identifies every out of stock for a period of time, in this case the most recent four weeks, and then calculates the average rate of sale by store.  Since the average unit retail price is known, we can calculate the estimated sales lost by looking at the units which would have been sold had the product been in stock, and multiply that number by the average unit price. The customer I was working with was shocked to see that out of stocks at their largest retail customer was costing them a little over $3,500 per week.  That added up to about $14,000 for the four-week period we analyzed. The customer took our report to their replenishment manager, along with a recommendation to place an order sufficient to cover the next eight weeks of expected demand.  The end result was an increase in sales of 3.5%!

We often have conversations with customers where they cite an in-stock rate of 99%. But, when you’re out of stock 1% of the time, the financial impact can add up quickly.  The customer I referenced above was running at 99.1% in stock, and we still increased their sales!

Reducing out of stocks is a complex problem, with many moving parts and multiple parties that have to execute in harmony, or the entire system breaks down. But, you can’t manage and improve what you are not measuring. And it’s hard to believe a vendor is making an effort to reduce OOS if they are not measuring on-hand at their retail customers. If you are a vendor dependent on a retailer maintaining good shelf availability to grow your sales, then you need to proactively manage in-stock. That means, if your retailer makes POS activity available at midnight Sunday, your team should be taking action by 11:00 am Monday morning. Not just loading data into a spreadsheet, so they can start the analysis process. Or worse yet, not even receiving any data at all. Timely reporting and analysis on your in-stock and out-of-stock data across your retailers is a proactive step toward battling that steady, average out of stock rate of 8%.

For additional information, download out whitepaper titled Out of Stock Analysis available in the resource center.

Data-Driven Series: Know Your Customer Type

Data Analysis

Both The Home Depot and Lowe’s continue to focus on the “Pro” customer as the key growth driver for sales. In the case of The Home Depot, there are some interesting store attributes available to vendors, which The Home Depot uses as store descriptors. Last week, I was working with one of our customers who sells product at The Home Depot, and I had an opportunity to help them prioritize where to focus their efforts in 2017. I recommended they spend time identifying, analyzing, and creating specific sales plans for all Pro stores.

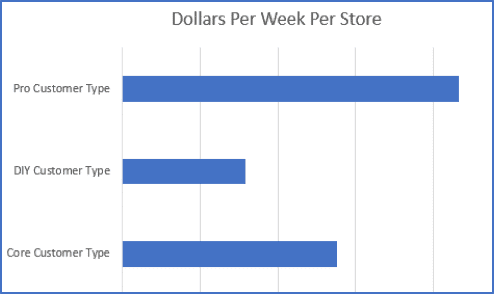
To get the conversation started, I showed the vendor a simple summary of dollars per week, per store by customer store type. There are three customer store types: Pro, DIY and Core. Figure 1 shows the average weekly sales by the customer store type. The Pro stores are clearly leading the group in average weekly sales per store by a substantial amount (Figure1).
Dollars Per Week Per Store
Among their 2,200 stores in North America, about 300 Home Depot stores have the Pro customer type attribute. This subset of stores is easily analyzed on a deep dive basis, and results can have a substantial impact on your total sales if you create the correct strategies and execute them well.

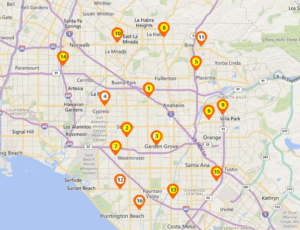
To help my customer understand the importance of the store customer type attribute, I pulled 2016 sales for The Home Depot stores in the Anaheim, CA market. If you simply type Anaheim into the homedepot.com store finder you will get back a list of 16 stores. Then, I looked at the total sales by store for each store, and segmented them based on customer type. In the Anaheim market, 12 stores are tagged as Pro stores, 4 stores are tagged as Core, and zero stores are tagged as DIY. Figure 2 identifies the Pro stores with a yellow tag and the Core stores using a white tag. The Pro stores averaged an additional 21% in sales compared to the Core stores.
Sell Thru Time

As we discussed how to leverage this information, I asked the VP of Marketing to pull a list of display promotions for 2016 in the Anaheim market. They ran two displays last year in the market – one in the spring and one in the fall. Each display was a pallet display in the aisle, at the front of their department, with 48 units of product. The average sell-thru time at the Pro stores was 3.75 weeks. The average sell-thru time at the Core stores was 5.35 weeks. The Pro stores are clearly superior when it comes to a high sell thru on a display, and we concluded it would not make sense to ship a display to the 4 Core stores in 2017. Instead, they are allocating those displays to four Pro stores in the Sacramento market. Based on 2016 sales we would expect those displays to perform at similar sell-thru to the Pro stores in Anaheim. Those Sacramento stores did not have a display last year so the sales will represent net new dollars for 2017.

Working to gain an in-depth understanding of stores and their attributes can seem like an overwhelming task when you first tackle the project. With thousands of stores and about three dozen attributes, there are a lot of variables to consider. I find it’s helpful to start with the attributes you hear Home Depot executives focusing on, and then move along to other attributes as you gain efficiency in your analysis. The Home Depot (and Lowe’s) are both very focused on the Pro, which means you should be as well.

DATA-DRIVEN Series: What You Can Learn From Your Average Retail Selling Price

Data Analysis

Last week, I had the opportunity to work with two different customers analyzing their sales at The Home Depot.  One sells products in the paint department and the other sells into the building materials department.  The analysis goal for both customer projects was to deconstruct their YTD sales and identify the factors contributing to higher than expected comp sales increases.  Both customer’s sales for a set of key SKU’s were up about 2.5% YoY and the question they wanted answered was, “What is driving the higher sales, and will it continue?”

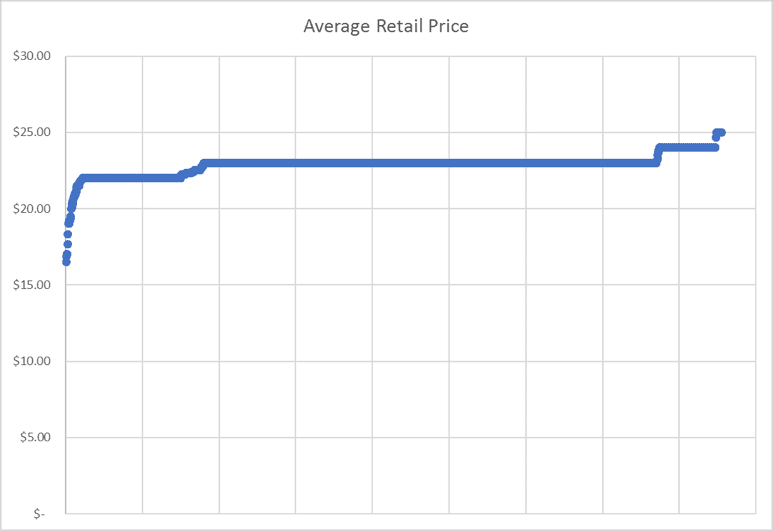
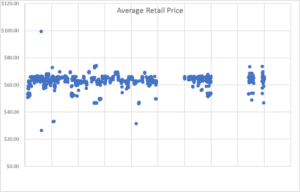
Average Retail PriceAs we deconstructed their respective sales into its component parts of distribution, price, and rate of sale, we uncovered interesting data regarding average retail selling price.  The first customer’s average retail price was pretty consistent across Home Depot stores at the expected $22.95 retail price.  There were some fluctuations, but the data was pretty clustered, as expected.


In contrast, the second customer’s average retail price was very inconsistent.  Customer #2 believed that The Home Depot was pricing their core SKU at $59.95 or $65.95, depending on the market.  However, as you can see in Figure 2, the pricing was very inconsistent across stores.  In fact, we identified stores in the same Home Depot market with a selling price variance of $28.35 per unit.

Home Depot EDI

While there can be good reasons to price a product differently by market due to shipping costs or competitive pressures, it seems irregular to have different prices within the same market.  Take a look at the average retail price of your products. It’s an important exercise that can yield some interesting insights.  It presents an opportunity to have a conversation with your merchant about pricing strategies.  And, It also provides an opportunity to identify markets with similar demographic profiles, but different selling prices, thus providing insight into what price point drives the highest sales.

Does your average selling price match your expectations?  The answer may not be as simple as you think and could reveal some interesting insights.

Home Depot EDI

What’s New in Digital and Social Media for Beauty?

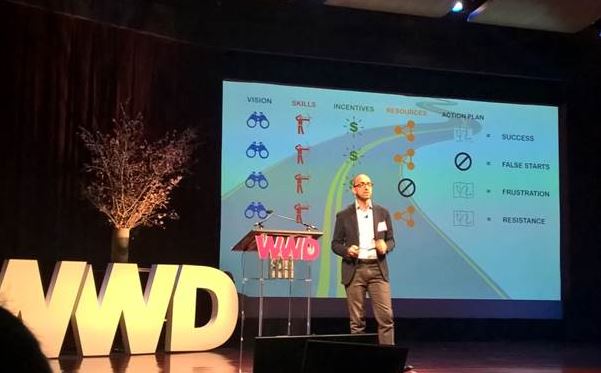
At Accelerated Analytics, I work with over 20 beauty brands to supply key reports and analysis of how their products are performing at their retail stores. Our expertise, based on years of working with beauty retailers like Dillard’s, Ulta, Sephora and Nordstrom, help account executives, planners and sales reps to track sales to goals, store display marketing, promotional effectiveness and inventory stock levels. I joined the WWD Digital Beauty Forum in New York on Tuesday to hear where the beauty industry is going with digital marketing and social media. Beauty Industry and Social Media

It was an inspiring day! From hearing how the Estee Lauder brand Smashbox is revolutionizing how to use social media influencers to expand their brand awareness, to learning how beauty brands like NYX and Shiseido are using digital technologies to expand social experiences online and in stores to broaden their customers’ experiences was mind blowing. In the ever-important retail need to address the increasing customer desire to have an experience, and not just shop, the beauty industry is using technology in a variety of ways to personalize what they can do for their customers and make their brand fresh, exciting and fun!

Beauty products are personal. Ecommerce efforts to use digital technology to put colors and skin care effects into a virtual customer’s hands live, is amazing. When a customer is in a store, actually touching products, digital technology gives shoppers a hands-on experience to custom-tailor products. Events and contests around pop-up stores is getting more and more common.

What resonated the most with me is, with so much activity and options for shoppers, and the very fast pace of beauty sales, the ability to see what is selling organically and where inventory is at all times is critical. I’m excited that our solution helps my beauty customers, like Coty, L’Oreal, Bvlgari and Parlux, to get the insights they need, when they need it, and gives them the opportunity to expand their digital reach to customers and react quickly when these initiatives take off!

Are Omnichannel Shoppers More Valuable to Retailers?

Omnichannel Retail

That’s the question that the Harvard Business Review set out to answer in a recent study conducted between June 2015 and August 2016. They collaborated with a major U.S. Company which operates hundreds of retail stores across the country and studied the behavior of 46,000 shoppers. The customers were asked about “every aspect of their shopping journey with a retailer”, focusing on which channel’s they used and why. The majority of the shoppers who participated – 73% – used multiple channels during their shopping experience and were deemed “omnichannel customers” by the study. Only 7% were online-only shoppers and 20% were store-only shoppers.

In tabulating results, the study considered each app, digital tool and shopping venue provided by the retailer as a separate channel, and discovered that the more channels customers use, the more valuable they are. In fact, the study revealed that omnichannel customers are “more valuable on multiple counts.” They spent an average of 4% more on every shopping occasion in the store, and 10% more online than single-channel customers. Additionally, with every channel that an omnichannel shopper used, they spent more money in the store. For example, compared to shoppers who used just one channel, customers who used four or more channels spent an average of 9% more in the store.

In additional to spending more, omnichannel shoppers were more loyal. According to the study findings, within six months after an omnichannel shopping experience, these customers had logged 23% more repeat shopping trips to the retailer’s stores and were more likely to recommend the brand to family and friends than those who used a single channel.”

Source: Harvard Business Review

Accelerated Analytics Customers L’Oreal and Coty Ink Big Business Deals in the New Year

L'Oreal and Coty DealsThe string of beauty deals continues in the new year with significant beauty acquisitions for Accelerated Analytics customers L’Oréal and Coty, all within a 48-hour period earlier this week.

L’Oréal will almost double the size of its Active Cosmetics Division with the acquisition of CeraVe, AcneFree and Ambi for a reported $1.3 billion. Founded in 2005, CeraVe develops cleansers, moisturizers and baby products and is one of the fastest-growing active skincare brands in the United States, L’Oréal said. AcneFree provides acne treatments and skin cleansers, while Ambi makes products to treat dark spots and brighten skin. The new trio of labels generates yearly revenue of about $168 million combined, and puts L’Oréal head-to-head with Nestlé’s blockbuster brand Cetaphil.

“Although the price is very high,” said Eva Quiroga, an analyst at Deutsche Bank, “it is supported by the strong growth the business will likely achieve, initially in the U.S. and eventually on a more global basis. It is the kind of global expansion that L’Oréal has historically excelled at.”

Coty is the latest consumer-products maker to acquire an online start-up with the purchase of Younique, a Utah-based company that makes its own line of skin care, body care and makeup products that are sold via peer-to-peer social selling. Coty will acquire 60% of Younique for $600 million in cash and Younique founders Derek Maxfield and Melanie Huscroft will own the remaining 40% and stay with the company in executive roles. Younique’s sales are made mostly online through virtual parties on Facebook and other social platforms. Modeled after more traditional direct-selling models, Younique is part of a group of young companies that have adapted the model to the internet age.

Sources: Reuters, Women’s Wear Daily

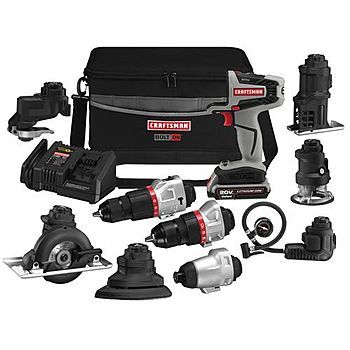
Stanley Black and Decker to buy Craftsman

The latest in a recent flurry of moves to raise cash, Sears Holding announced Thursday that it will sell its well-known Craftsman tools brand to Stanley Black and Decker. The value of the deal could top $1 billion.

Stanley will pay $525 million up front – the deal is expected to close later this year – and another $250 million at the end of year three. Stanley will also pay Sears a percentage of its new sales of Craftsman products for 15 years, and Sears will continue to sell Craftsman-branded products through a perpetual license deal, which will be royalty-free for the first 15 years, and royalty-bearing after that.


“This agreement represents a significant opportunity to grow the market by increasing the availability of Craftsman products to consumers in previously underpenetrated channels,” said Stanley President and CEO. “We intend to invest in the brand and rapidly increase sales through these new channels, including retail, industrial, mobile and online.”

Sears, once an icon of American retail, has reported declining sales for years. In addition to the Craftsman deal they also announced plans to close 150 more of their struggling Kmart and flagship Sears stores.

Sears CEO Eddie Lampert said that Sears “will continue to take actions to adjust our capital structure, meet our financial obligations and manage our business to better position Sears Holdings to create long-term value.”

Sources: CNN, Chicago Tribune, HBS Dealer

Robert Lighthizer Named Chief Trade Negotiator

Yesterday, President-elect Trump named veteran Washington trade lawyer Robert Lighthizer as his chief trade negotiator in a move that confirms Mr. Trump’s intention to get tough with China, Mexico and other trade partners.

Lighthizer, who is with the firm Skadden, Arps, Slate, Meagher and Flom and was deputy trade representative during the Reagan administration, would replace Michael Froman, the Obama administration’s representative who led negotiations on a Pacific trade pact that would have covered nearly 40 percent of the global economy and was seen as a counterpoint to China’s rising clout.

Trump, however, argues that deals such as the North American Free Trade Agreement and the Trans-Pacific Partnership kill American jobs. He has vowed to make smarter deals and has signaled a tough stance on trade with China, including levying a hefty tariff on Chinese imports.

Lighthizer has previously accused China of unfair trade policies and has long advocated protectionist trade policies. In his role during the Reagan administration, he helped to stem the tide of imports from Japan in the 1980’s with threats of quotas and punitive tariffs. In public testimony in 2001, Lighthizer argued that China has failed to live up to commitments made in 2001 when it joined the Word Trade Organization and that more aggressive tactics are needed to “force change in the system.”

The Wall Street Journal’s William Maudlin writes that the choice of Lighthizer as U.S. trade representative signals a sharp shift in trade strategy that will include a move away from multilateral deals, a tougher approach to China and Mexico and the threat of duties to impose higher costs on imports”. Mainstream economists warn that protectionist policies like import taxes could impose higher prices on consumers and slow economic growth.

Sources: Wall Street Journal, Bloomberg, Rueters

The Omnichannel Holiday Challenge with Store Inventory and Forecasting

Holiday shoppers have just a few more days to get their shopping done. Do they order online and get it shipped? Do they order online and then pick up in store? Or do they go into a store hoping to walk out with the items they want to purchase? Retailers have the challenge of meeting all of these needs, many of them using store inventories as distribution centers to handle online purchases, whether shipping it to the customer’s home or having it available so they can pick up the item in the store.

An online customer who is having their products shipped does not care which store or warehouse handles their purchase. A shopper in the store or on the way to a store does – they expect the item to be available on the shelf. Retailers are using different strategies to manage these needs. Some, such as Target, are holding inventories back from online purchasers in order to keep inventory on the shelf for their in-store shoppers. In Target’s example, an online shopper may try to go online and buy or reserve an item in store but are unable to do so. Other retailers, like Toys ‘R Us, have a “first-come, first-served” strategy. The big challenge is for retailers to determine, by product and by store, how to divvy up the store’s stock, and need to forecast in-store purchases to try to have the right amount of inventory on the shelves.

Store Inventory Forecasting

Tracking item-store inventories as real time as possible is the best way for these retailers to make these forecasts. Retailers without inventory systems who can keep up with purchases are having to keep extra available in the store and not online, in order to avoid the mistake of selling the same item to two customers around the same time.

Source: Chicago Tribune.com, Wall St. Journal