Author: Chad Symens

Ace Hardware Announces New Distribution Center in PA

Ace Hardware Corporation, with 5,000 locally owned and operated stores in all 50 states and 60 countries, announced Thursday it will be opening a 1.1 million square-foot distribution center in Bethel Township, PA. The company is investing $20M to create the DC, and will serve stores in Pennsylvania, New York, New Jersey and Washington, DC. The new distribution center will create 208 full-time jobs over the next 3 years.

Lori Bossman, executive VP for supply chain, inventory replenishment and retail support, stated, “The opening of our new distribution center will create operational efficiencies across our entire supply chain network. Stores serviced from this facility will benefit from the stocking of thousands of products and a more streamlined approach to merchandise distribution.”

In addition to The Home Depot, Lowe’s and other DIY retailers, Accelerated Analytics now has insightful Ace Corporate sales and forecast data to add to its customers reporting and analysis tool for 1800 US Ace corporate stores. Contact jennifer@acceleratedanalytics.com to find out more about this exciting opportunity to incorporate Ace Hardware into your weekly reporting, and check out our DIY Solutions page on our website to learn more about how this reporting can help your Account Executives, Marketing and Planning Executives, Field Sales Reps and IT department use our expert POS analysis and tools to respond faster to consumer trends, optimize inventory at your DIY retailers and increase overall sales.

Source: Wall St. Journal
Mother’s Day Spending Expected to Reach a Record High

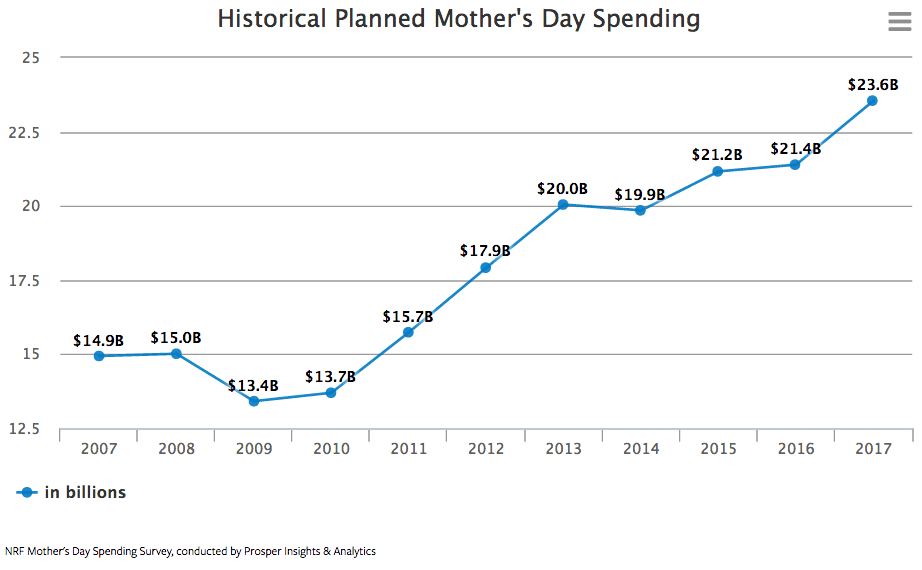
According the National Retail Federation’s annual survey, Mother’s Day Spending is expected to reach a record-high of $23.6 billion. That’s the highest number in the survey’s 14 year history, topping last year’s previous record of $21.4 billion.

The 85% of those surveyed who said they will be celebrating the holiday say they will spend more this year than last as they search for the perfect gift to celebrate the special moms in their lives. As consumers shower moms with everything from flowers to jewelry, they are expected to spend an average of $186.39 this year, up from last year’s $172.22

“With spring in full bloom, many Americans are looking forward to splurging on their mothers this Mother’s Day,” NRF President and CEO Matthew Shay said. “Retailers will be ready with a wide range of gift options and a variety of promotions for their customers.”

According to the survey, consumers plan to spend $5 billion on jewelry and $4.2 billion on special outings such as dinner and brunch. Flowers, gift cards and greeting cards will also account for significant portions of the total Mother’s Day sales.

When it comes to where consumers will do their shopping, surprising, over 1/3 of them (35%) will head to department stores. Specialty stores and local businesses like florists and jewelers will also enjoy visits from shoppers. Meanwhile, 30% will shop online, up from 27% last year.

Whether you choose to shop in a brick and mortar store or take to the internet for your Mother’s Day shopping, Accelerated Analytics customers like Coty, Vera Bradley, Swarovski, Chanel and L’Oreal offer a wide range of fashion and beauty gifts than any mom is sure to love!

Home Improvement Growth Expected to Continue in 2017

Like an extreme theme-park rollercoaster, the U.S. housing market has dipped and turned and raced and plummeted over the past decade. And, when the housing market crashed in 2007, it was not surprising that home improvement spending also declined. Ten years later, the overall housing market is stable, but the construction of single-family homes has been very slow to recover. As detailed in the April edition of the Retail Industry Briefing Book, single-family housing starts hit 872,000 in February; up slightly from January’s figures, but still sitting below pre-recession levels.

The home-improvement industry however, has fared much better in the aftermath of the housing market bust and economic recession. As seen on page 27 of the April RIBB, the Leading Indicator of Remodeling Activity (LIRA) compiled by the Joint Center for Housing Studies (JCHS) at Harvard University “projects that annual growth in home improvement and repair expenditures will remain elevated throughout 2017 with spending levels ending the year up 6.7 percent at $317 billion.”

Home Improvement Retail IndustryIn their January 2017 report Emerging Trends in the Remodeling Market, the JCHS further explains that the more than 130 million homes in the United States require regular investment to offset normal depreciation. And, many households that might have traded up to more desirable homes during the recession decided to make improvements to their current homes instead. In addition, federal and state stimulus programs encouraged homeowners to invest in energy-efficient upgrades that they might otherwise have deferred.

“Growth in home prices is continuing at a healthy pace and encouraging homeowners to make remodeling investments,” says Chris Herbert, Managing Director of the Joint Center for Housing Studies.

That’s great news for home improvement stores like The Home Depot and Lowes. As seen on page 39 of the April RIBB, The Home Depot’s closing stock price is up 10% year-to-date and Lowe’s stock price is up 16% year-to-date. And, as detailed on page 34 of the RIBB, using data compiled for the Accelerated Analytics Vendor Index, dollars sold per week in 2017 is consistently greater than the same week in 2016 for The Home Depot and Lowes.

Sources: JCHS, wsj.com

Luxury Retailers Suffer Amid the Transparency of Online Competition

Luxury retailers have historically been considered immune to the challenges of mass-market chains, like declining foot traffic and endless price wars, but that no longer appears to be true. High-end retailers are learning that even wealthy customers are hunting for better deals and selection empowered by the pricing and supply transparency of an omni-channel marketplace.

“In the past, women had loyalty to a particular department store, and they would come in with a page torn from the retailer’s catalog and say, ‘I want that look,” said Robert Burke, the former fashion director of Bergdorf Goodman who now runs his own consulting firm.

According to global management consulting firm Bain & Co., sales of personal luxury goods such as apparel and handbags fell 1% last year, the first decline since 2009.

Few are feeling the heat like luxury retailer Neiman Marcus, which holds nearly $5 billion in debt. When Neiman Marcus opened its first store in Dallas in 1907, they built their brand catering to the wealthy.

“Our mantra had always been, ‘There is nothing too expensive for our customer,” one former executive said.

Neiman Marcus routinely increased average prices by 7% – 9% annually until 2015. But the model of lifting profits by simply raising prices has fallen out of fashion. The same strategy has been common among many luxury retailers giving consumers little choice because distribution of high-end goods was tightly controlled by the brands. And until recently, few luxury goods were sold online giving brands tighter control of pricing.

“One of the tricks to luxury is price discipline,” said Aaron Cheris, the head of Bain’s retail practice for the Americas. Shoppers pay full price, he said, when they can’t “get stuff for less.”

But competition from online and discount retailers, where prices change rapidly to remain competitive, is forcing discounts and forcing change to remain competitive.

In today’s WSJ Logistics Report, author Paul Page wrote that luxury retailers need to “look for ways to lower production and distribution costs, use data in a more sophisticated way and follow their customers in displaying a new kind of discipline in pricing.”

Accelerated Analytics provides POS reporting and analysis for several luxury brands like Bvlgari, Chanel, Oscar de la Renta and more, who sell through luxury retailers like Neiman Marcus & Bergdorf Goodman. You can learn more about our expert data and analysis solutions for fashion and beauty vendors on the solutions pages of our website.

Sources: wsj.com, WSJ Logistics Report

To subscribe to our weekly news updates and have our content delivered directly to your inbox each week, enter your e-mail address at the bottom of our Home page.

2017’s Year-to-Date Store Closings Top Historical High Set in 2008

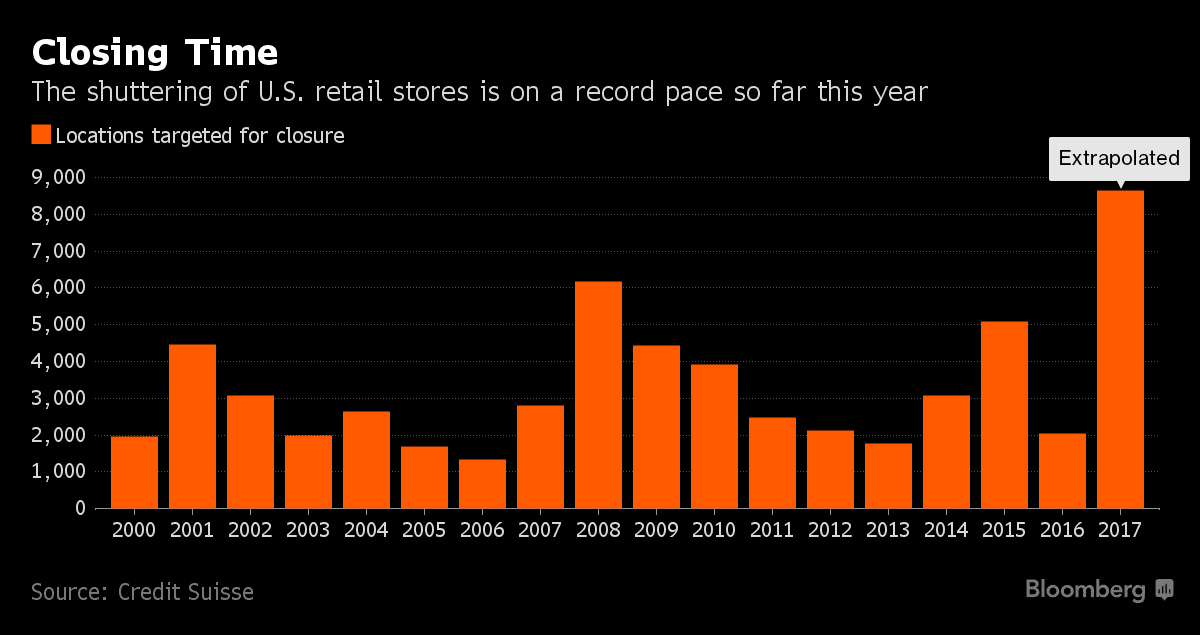
According to a Credit Suisse report released Thursday, 2017 year-to-date store closings have already topped the historical high set in 2008 when the last U.S. recession was raging. About 2,880 stores have closed year to date compared to 1,153 at the same time last year. And since 60 percent of store closures are typically announced in the first five months of the year, Credit Suisse estimates that there could be as many as 8,640 store closings this year.

This week saw stores at both ends of the price spectrum preparing to close their doors. Payless Inc. shoe chain filed for Retail Stores Closingbankruptcy on Tuesday and announced plans to close hundreds of locations. Meanwhile, Ralph Lauren Corp announced it will close its flagship Fifth Avenue Polo store.

While the unemployment rate fell from 4.7 percent to 4.5 percent in March (the lowest since May of 2007), the retail industry took a hit with the worst two months for job creation since December 2009, according to the Bespoke Investment Group. Almost 30,000 retail workers lost their jobs in March, and more than 60,000 jobs have been eliminated since January.

“Retail is a mess, to say the least” proclaimed Jason Mudrick, hedge fund manager and the founder and current President and CIO of Mudrick Capital Management, on Bloomberg Daybreak: Americas earlier this week. He continued, “this is not a cyclical issue . . . this is a forever trend.”

As stores are closing faster than ever, US shopping malls are left with a glut of space to fill. Last month CEO of Urban Outfitters Richard Hayne sized up the situation by saying, “This created a bubble, and like housing, that bubble has now burst,” he said. “We are seeing the results: doors shuttering and rents retreating. This trend will continue for the foreseeable future and may even accelerate.”

Industry analysts like Oliver Chen at Cowen & Co recommend that retailers “refocus on customers. Management needs to be fixated on speed of delivery, speed of supply chain, and be able to test read and react to new and emerging trends.”

Detailed, expert reporting and analysis of retail POS data enables vendors to do just that. In a blog post on our site earlier this week, technology journalist Scott Koegler wrote about the benefits of using a retail data analysis tool like Accelerated Analytics to improve supply chain responsiveness.

“You can look at trends and predict item performance down to the shelf level in order to plan your recommendations to store buyers,” wrote Koegler. He continued, “Forward thinking suppliers are already taking advantage of the data their customers give them to sell more of their products.”

Sources: CNBC.com, Bloomberg.com, WashingtonPost.com

Get our content delivered to your inbox each week with our weekly update. Sign up at the bottom of our home page.

DIY Retailers Bloom Into Spring

DIY Retailers Home Depot

Barron’s reported on Sunday that home improvement retailers The Home Depot and Lowe’s are strongly positioned financially going into Spring. Homeowners are undertaking renovations and projects due to a healthier economy and improved real estate markets. Barron’s also states that The Home Depot and Lowe’s are “Amazon-proof” as home improvement is low on the list of categories Amazon is penetrating.

The Home Depot has out-performed Lowe’s over the last several quarters in same-store performance, but Lowe’s is attractive to investors for its lower price-to-earnings ratio. Both retailers are expected to see revenue and stock price increases.

Lowe’s trades at $82, 18 times its $4.62 earnings per share, while The Home Depot trades at $147, 20.4 times its earnings of $7.19 per share.

Accelerated Analytics provides POS reporting and analysis for dozens of DIY vendors who sell through home improvement retailers, reporting on over $11B in sales per year in this segment alone. DIY vendors can learn more about our expert solutions for DIY, home and hardware vendors on our new website solutions pages.

Source: Reuters.com

Do You Really Know How Your Products Are Performing?

Point of Sale Data

Suppliers count it as a win when they place a product line with a major DIY chain like Home Depot or Lowes. But understanding the details of how your products are selling can enable you to maximize your efforts and make the most of the typically slim margins you’re able to negotiate. The good news is that your retailers give you the information you need every week. But you need to use the right tools to turn their raw data into actionable insights.

Get the data

Major retailers routinely make their point-of-sale (POS) transaction data available to their suppliers, but the complexities of collecting and digesting it in a reasonable time frame get in the way of actually using the information. While some retailers use the standard EDI 852 format to deliver their weekly cash register data to suppliers, each retailer modifies the content of those files to meet their own needs. That means you need to convert the files to a common format before you can even start to analyze them. And some retailers don’t use the standard format, preferring to send spreadsheets or simply raw text files, further complicating the job of standardizing the data and readying it for analysis.

Look inside

The good news is that once you’ve cracked the code and converted all that POS data into information, you can look at trends and results from a variety of different perspectives. From a high level, the data can let you know what regions and which stores are selling each item. And analysis platforms like Accelerated Analytics  go even farther. According to Jennifer Freyer, Director of Sales and Marketing for Accelerated Analytics, “Suppliers can take advantage of different reports, easy to read dashboards, and geographic heatmaps. It’s easy to click and see where inventories are too high or too low, then drill down to store level for specifics. They can track promotions and see which stores are hitting or not hitting sales goals.” By using those kinds of tools you can decide to adjust your product mix to better allocate items that may be in short supply.

Make it a reality

Because POS data is delivered weekly, you can look at trends and predict item performance down to the shelf level in order to plan your recommendations to store buyers. But most vendors don’t have the time and technical ability to deal with the inbound data, much less the complexity of converting the various data files into a common format, then apply the analytical processes needed to produce easily understandable results. Fortunately services are available from experts in doing exactly this kind of work and can do the heavy lifting for you. They deliver a variety of reports that have been field tested and designed based on common issues suppliers face and they are customizable to meet the specifics of your business, products, and customers.

Suppliers can gain insights and help to direct their field staff to look for and correct conditions that can improve sales of their products, like improper placement on shelves. But of possibly more impact may be the ability to assist the retailer’s product managers with their responsibilities by proactively advising them on opportunities to make changes in product assortments, then track and report those results to show their effectiveness. Forward thinking suppliers are already taking advantage of the data their customers give them to sell more of their products.

Scott Koegler is a technology journalist with 20 years experience writing about business, computing and technology topics.

Accelerated Analytics Customer Coty Enters Strategic Partnership with Burberry

Source: us.burberry.com

According to a press release issued today, Accelerated Analytics Customer Coty Inc. (NYSE: COTY) has entered into an agreement to acquire the long-term global license rights for Burberry Beauty luxury fragrances, cosmetics and skincare. Under the agreement, Coty will develop, manufacture and distribute the full range of Burberry Beauty products globally. The exclusive agreement will take effect in October of this year, subject to regulatory approvals.

Camillo Pane, CEO Coty, said, “We are proud to welcome Burberry as a strategic partner of Coty.  We look forward to growing further Burberry’s luxury beauty products using Coty’s world-class expertise in developing and bringing to market beauty brands.”

Burberry, which moved its beauty division in-house in 2013 after licensing it to a third party, said it would retain creative control of the division, while benefitting from “Coty’s deep beauty industry expertise and first-class global distribution.” Known for its British-made trenchcoats, Burberry’s fragrances include My Burberry and Mr. Burberry and it has expanded into cosmetics in recent years to help introduce its brand to younger consumers.

Coty and Burberry will work in partnership on delivering best-in-class creative executions and leverage Coty’s global capabilities in beauty strategy, innovation, supply-chain and go-to-market.  Burberry beauty products will be sold in leading luxury beauty retailers globally as well as in Burberry stores and digital channels.

Commenting on the strategic partnership, Christopher Bailey, Chief Creative and Chief Executive Officer, Burberry, said, “We are delighted to partner with Coty, a world leader in luxury fragrance and make-up.  Working with a global partner of Coty’s scale and expertise will help drive the next phase of Burberry Beauty’s development and position this business for growth.”

———————————-

Accelerated Analytics provides retail POS reporting and analytics by brand and by house for over 20 retailers for Coty’s Philosophy brand and their newly acquired P&G brands.

A Better Method for Evaluating Store Performance

Evaluating Store Performance

Last week I had an interesting discussion with my team about a customer whose focus is on improving store performance at their retail customers in 2017.  This customer is well represented with their entire product line at all doors at their key accounts, so they want to ensure each door is producing the maximum number of sales.  In our experience, brands selling products through retailers most frequently grade store performance using total dollars sold. The most common report shows total dollars sold by store for a rolling 4-week period, YTD and rolling 52 weeks. Stores with the highest total sales are assumed to be the “best” doors.  However, the top line sales figure doesn’t really give you the entire picture of store performance. The stores might have different assortments and inventory allocation can vary by store resulting in lost sales due to out of stocks. Total dollars sold is more useful when you look at a single SKU across stores, but in this case the goal was to choose one KPI for a door across all SKU’s.

Metrics you might use to determine store productivity include:

  • Total dollars sold
  • Sell-Thru %
  • GMROI
  • Inventory turns
  • Gross margin $
  • Average dollars per week per store

Let’s take a look at five stores and see which one is the ‘best’ store.   The table in Figure 1 shows the total sales for five stores over the most recent 52 weeks.  With a little sorting of our data by dollars sold descending we can add a store rank and identify that store 4758 is the “best” store and store 3529 is the “worst”store.   See Figure 2.

Figure 1

Store Number Rolling 52 Week Sales
4758 $738,394
3529 $457,938
7847 $627,348
5463 $584,393
2737 $495,494


Figure 2

Store Number Rolling 52 Week Sales Store Rank
4758 $738,394 1
7847 $627,348 2
5463 $584,393 3
2737 $495,494 4
3529 $457,938 5


Unfortunately, this is where the analysis of store performance all too frequently ends. Using total sales as the only KPI doesn’t provide any information on the financial return of inventory in the store. The sales could be very high, but the margins might be very thin, or even negative, and what appears to be a very high performing store could actually be unprofitable.

A better KPI for evaluating store performance is gross margin return on investment (GMROI).  GMROI tells you how much profit your inventory generated. For example, if your GMROI is 3.7 then your inventory returned $3.75 for every $1 dollar you invested into inventory.  A GMROI below 1 indicates you are losing money on every $1 dollar of inventory. For a refresher on how to calculate GMROI, visit our prior blog.

In Figure 3 we added the GMROI for each store and then in Figure 4 the stores are ranked by GMROI.    Notice store 4758 which was ranked number one based on total sales is actually fourth when you look at the GMROI. Store 5463 is creating $4.10 in profit for every dollar of inventory invested.

Figure 3

Store Number Rolling 52 Week Sales GMROI
4758 $738,394 2.7
7847 $627,348 3.2
5463 $584,393 4.1
2737 $495,494 3.9
3529 $457,938 1.7


Figure 4

Store Number Rolling 52 Week Sales GMROI Store Rank – TTL Sales Store Rank – GMROI
5463 $584,393 4.1 3 1
2737 $495,494 3.9 4 2
7847 $627,348 3.2 2 3
4758 $738,394 2.7 1 4
3529 $457,938 1.7 5 5


When you consider retailers invest 60% to 80% of their available capital into inventory it makes sense to use GMROI as the basis for evaluating store performance.  Here are some actions we recommend you take this quarter with your key retail accounts:

  1. Calculate GMROI by store.
  2. Calculate GMROI by brand by store.
  3. Ask your merchant for their GMROI target for your products.
  4. Do some research on GMROI for similar products.
  5. Create an exception report that highlights any store with a GMROI at or below 1. These are stores that need your attention.


JC Penney to Close 138 Stores in June. What’s the Impact on Sephora Inside JC Penney?

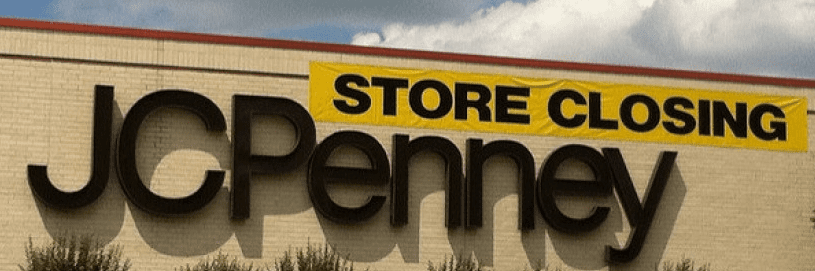
JC Penney announced it will be closing 138 stores and a supply chain facility in Lakeland, FL. The retailer explained the closings were strategically chosen to cut costs in order to focus growing sales at its best-performing locations. Texas and Minnesota were the hardest hit, with 9 and 8 store closures, respectively.

“We believe closing stores will also allow us to adjust our business to effectively compete against the growing threat of online retailers,” Penney CEO Marvin R. Ellison said in February. “It is essential to retain those locations that present the best expression of the J.C. Penney brand and function as a seamless extension of the omni-channel experience through online order fulfillment, same-day pick up, exchanges and returns.”

What will be the impact to Sephora Inside JC Penney stores? Today there are Sephora locations in over 574 JC Penney stores across the US. Using a smaller square footage footprint than a standard Sephora cosmetics store, each one is located in the middle of a JC Penney store and features the Sephora branding and beauty product assortment. This has been an extremely successful venture for JC Penney and Sephora. Comparing the Sephora Inside JC Penney store list to the list of closings reveals a very small impact to this partnership, with only 5 of the closing stores having a Sephora inside: one each in CT, IL, and MI and two stores in PA.

Sources: Chain Store Age, Sephora.com