
Both The Home Depot and Lowe’s continue to focus on the “Pro” customer as the key growth driver for sales. In the case of The Home Depot, there are some interesting store attributes available to vendors, which The Home Depot uses as store descriptors. Last week, I was working with one of our customers who sells product at The Home Depot, and I had an opportunity to help them prioritize where to focus their efforts in 2017. I recommended they spend time identifying, analyzing, and creating specific sales plans for all Pro stores.
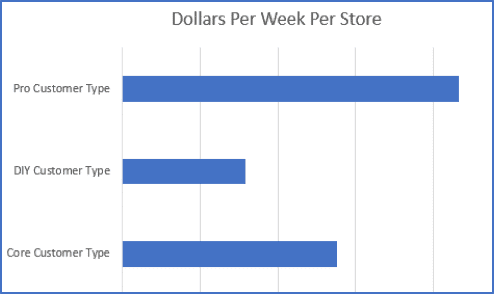
To get the conversation started, I showed the vendor a simple summary of dollars per week, per store by customer store type. There are three customer store types: Pro, DIY and Core. Figure 1 shows the average weekly sales by the customer store type. The Pro stores are clearly leading the group in average weekly sales per store by a substantial amount (Figure1).
Among their 2,200 stores in North America, about 300 Home Depot stores have the Pro customer type attribute. This subset of stores is easily analyzed on a deep dive basis, and results can have a substantial impact on your total sales if you create the correct strategies and execute them well.
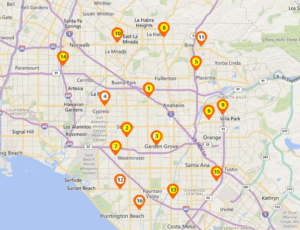
To help my customer understand the importance of the store customer type attribute, I pulled 2016 sales for The Home Depot stores in the Anaheim, CA market. If you simply type Anaheim into the homedepot.com store finder you will get back a list of 16 stores. Then, I looked at the total sales by store for each store, and segmented them based on customer type. In the Anaheim market, 12 stores are tagged as Pro stores, 4 stores are tagged as Core, and zero stores are tagged as DIY. Figure 2 identifies the Pro stores with a yellow tag and the Core stores using a white tag. The Pro stores averaged an additional 21% in sales compared to the Core stores.
As we discussed how to leverage this information, I asked the VP of Marketing to pull a list of display promotions for 2016 in the Anaheim market. They ran two displays last year in the market – one in the spring and one in the fall. Each display was a pallet display in the aisle, at the front of their department, with 48 units of product. The average sell-thru time at the Pro stores was 3.75 weeks. The average sell-thru time at the Core stores was 5.35 weeks. The Pro stores are clearly superior when it comes to a high sell thru on a display, and we concluded it would not make sense to ship a display to the 4 Core stores in 2017. Instead, they are allocating those displays to four Pro stores in the Sacramento market. Based on 2016 sales we would expect those displays to perform at similar sell-thru to the Pro stores in Anaheim. Those Sacramento stores did not have a display last year so the sales will represent net new dollars for 2017.
Working to gain an in-depth understanding of stores and their attributes can seem like an overwhelming task when you first tackle the project. With thousands of stores and about three dozen attributes, there are a lot of variables to consider. I find it’s helpful to start with the attributes you hear Home Depot executives focusing on, and then move along to other attributes as you gain efficiency in your analysis. The Home Depot (and Lowe’s) are both very focused on the Pro, which means you should be as well.