Tag: Point-of-Sale Analytics

Christmas Cheer Felt by Retailers This Holiday Season

Retailers Christmas Joy

With consumer confidence currently at a 17-year high (as reported in our Retail Industry Briefing Book) it makes sense that holiday retail sales in the U.S. rose at their best pace since 2011, according to Mastercard SpendingPulse, which tracks both online and in-store spending. Excluding automobiles, sales rose 4.9% from Nov. 1 through Christmas Eve, compared with a 3.7% gain in the same period last year.

“It started with a bang in the week leading up to Black Friday,” said Sarah Quinlan, a senior vice president of marketing insights at Mastercard. She added that retailers benefited this year from Christmas Day falling on a Monday, giving shoppers a full weekend to scoop up last-minute purchases. Dec. 23 ranked next to Black Friday in terms of spending, according to Mastercard.

“Overall, this year was a big win for retail,” Ms. Quinlan said.

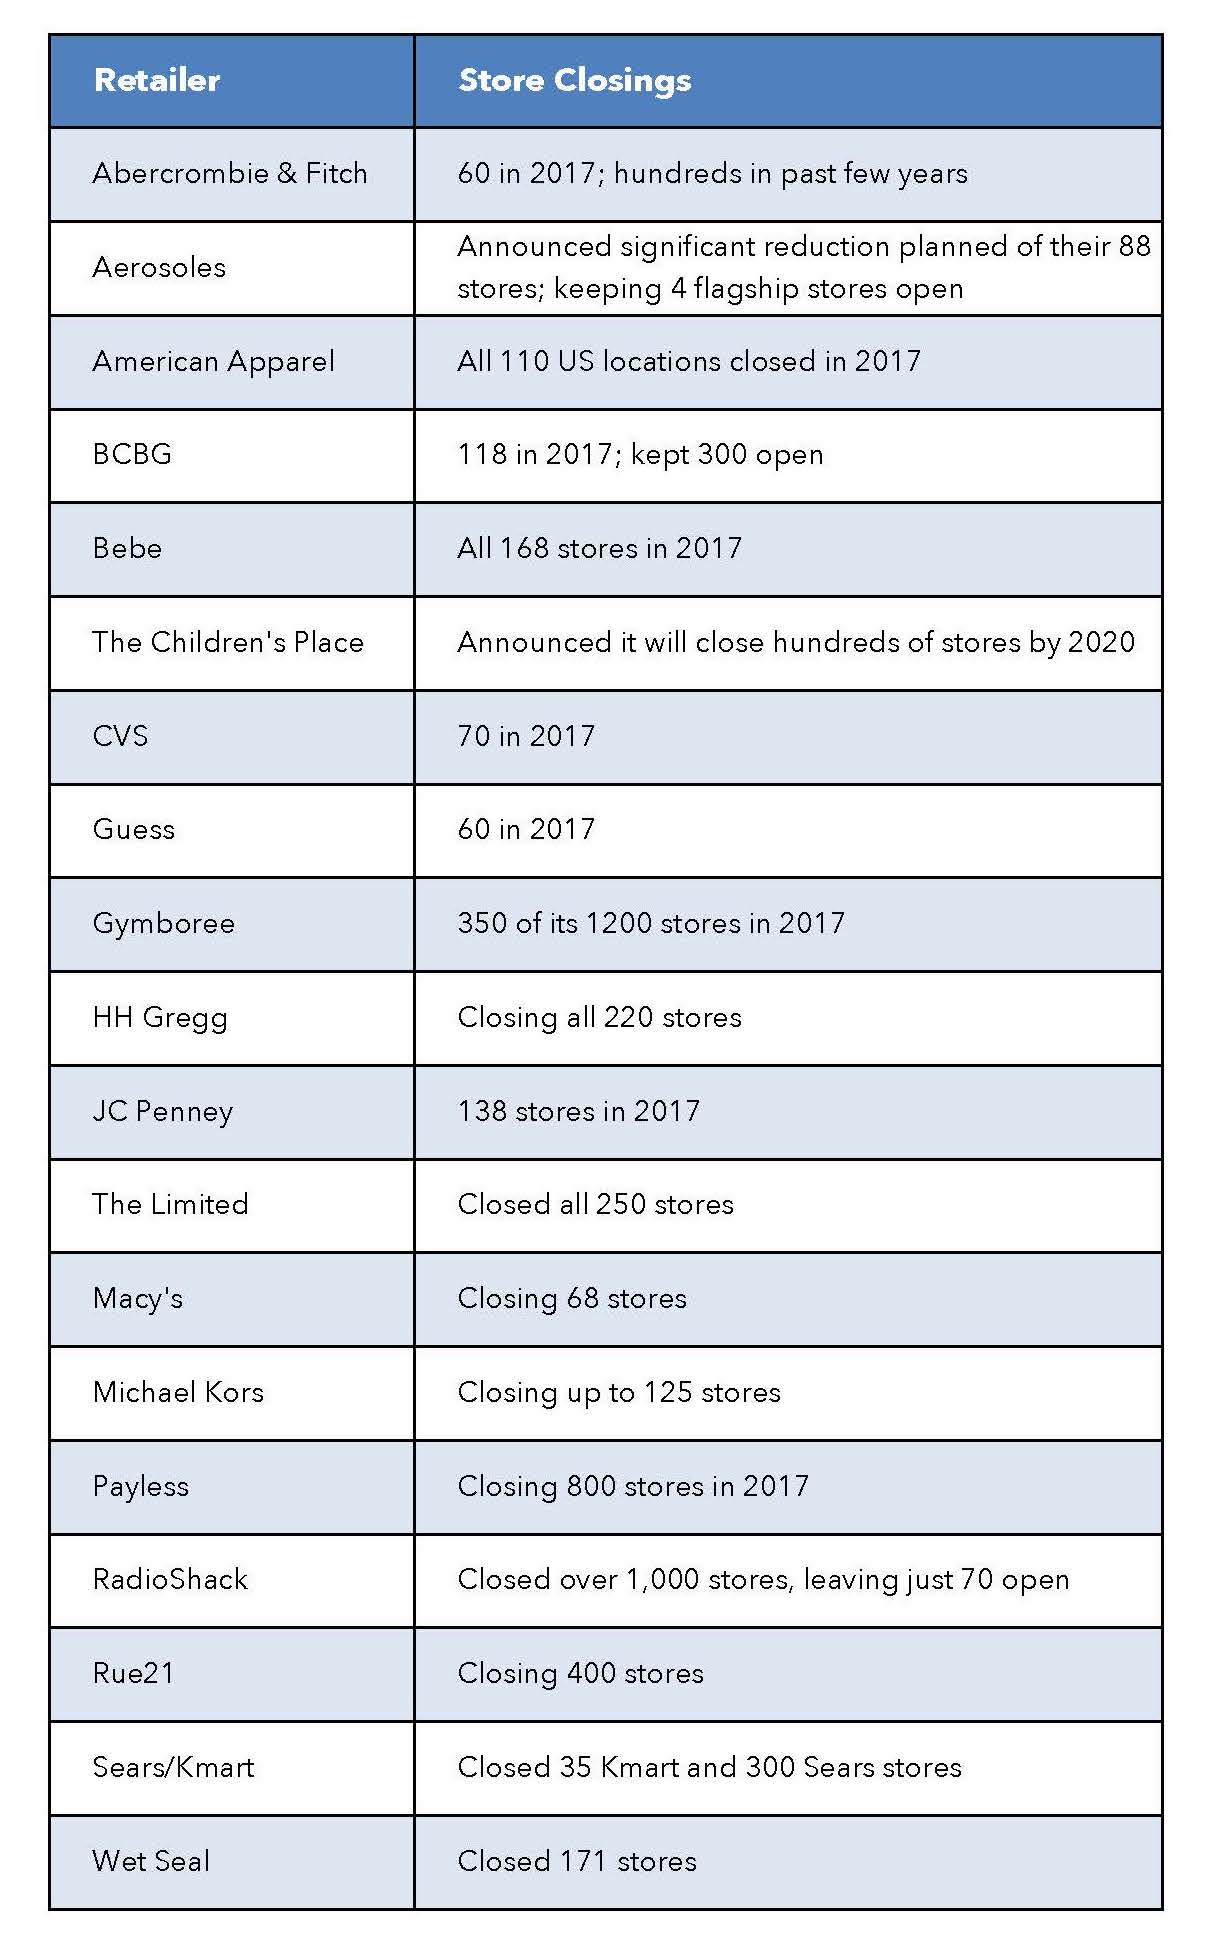
Retailers are breathing a sigh of relief. From department-store giants like Macy’s to mall favorites like The Gap, brick and mortar retail struggled through a difficult year of store closures.

In past years spending was driven by high-income shoppers, but this year there is a lot more spending from the lower- and middle-income groups due to rising wages and low unemployment.

Source: Wall Street Journal

The 12 Days of Christmas with Accelerated Analytics

On the first day of Christmas, Accelerated gave to me, a portal with all my retail data!

On the second day of Christmas Accelerated gave to me, 2 days free from spreadsheets,

On the third day of Christmas Accelerated gave to me, 3 clicks to run reports,

On the fourth day of Christmas Accelerated gave to me, 4% fewer out-of-stocks,

On the fifth day of Christmas Accelerated gave to me, 5% cost reductions

On the sixth day of Christmas Accelerated gave to me, 6% increase in sales,

On the seventh day of Christmas Accelerated gave to me, 7 expert reports to run my business

On the eighth day of Christmas Accelerated gave to me, 8 weeks hitting sell-thru targets,

On the ninth day of Christmas Accelerated gave to me, 9 retailers with increased profits,

On the tenth day of Christmas Accelerated gave to me, 10 happy executives,

On the eleventh day of Christmas Accelerated gave to me, 11 print & go reports for sales reps,

On the twelve day of Christmas Accelerated gave to me, 12 months of the Tools You Need to Win at Retail!

Get expert reporting tools for your company for the holidays this year and you’ll be singing these results next December!

2017: Year of the Retail Apocalypse

Retailers Closing in 2017

The year 2017 is being talked about as the “year of the retail apocalypse”. Over 3000 companies have filed for bankruptcy, and 20 big retailers have or are about to close hundreds of brick and mortar stores in the US. With the big holiday weekend of Thanksgiving/Black Friday and Cyber Monday behind us, consumers are proving that online shopping will continue to prevail, and retailers are making adjustments to focusing on digital platforms, while still trying to entice shoppers into their remaining stores. Being a big toy buying season, the announcement of Toys R Us’ bankruptcy filing is taking center stage, but the retailer maintains it will keep its 1,600 stores open. Amazon won the weekend with sales with 13 million transactions in just the first two days. They were followed by WalMart, Best Buy, Target and Kohl’s.

Amid the gloom, some retailers are still seeing success, and as many retailers shrink, other new retailers are making their way into brick and mortar to take their place. Perhaps rather than an “apocalypse’ retail is seeing an “evolution”.

Sources: Fox Business, Chain Store Age

Accelerated Analytics Customers Outperform Home Depot LY/TY Comps Again

Customers Outperform Rest of Brands in The Home DepotAccelerated Analytics customers who sell their products at The Home Depot saw their third quarter comp sales increase 9.2% over last year! That surpasses the results reported by The Home Depot in their recently released third quarter results. In a blog post on November 15th, we shared The Home Depot’s Q3 results which included reported sales of $25.0 billion, and comparable store sales for the third quarter of fiscal 2017 of positive 7.9 percent.

DIY, Home and Hardware vendors count on Accelerated Analytics to provide an expert reporting solution that empowers their sales, marketing and store operations teams. Our product and store level analytics provides the insights needed to exceed sales goals, increase orders to fully stock their shelves, test plan-o-gram efficiencies, and prepare for line reviews.

Our customers truly are winning at retail because we understand the home improvement retail business inside and out and provide a solution that is specifically targeted to, and designed for, a DIY vendor.

Why Data Scientist is a High Demand Job in Retail

Data Scientist in Retail

Despite ever-growing announcements of store-closings and retail layoffs, there’s one retail job that is still in high demand: data scientist.

With the explosion of e-commerce, brick-and-mortar stores are facing increased pressure to deliver an exceptional shopping experience to their customers; they have to find new ways to compete.

U.S. consumers still make about 85% of their purchases at physical stores, but with tougher competition, retailers and brands need an edge when it comes to nudging consumers toward a purchasing decision. That’s where the data comes in.

Retailers have traditionally made pricing, inventory and placement decisions based on the experience and intuition of their managers. But now data can answer those questions for you with more accuracy, without bias and in less time.

“Data is your friend,” said Jay Samit, a vice chairman at technology consulting firm Deloitte Digital. “Data has no ego. Data will never steer you wrong.”

According to a recent article on Bloomberg.com, major retailers like WalMart and Macy’s are ramping up their use of data and expanding their data teams.

“Five years ago, if you were to say there was a team of Ph.D. data scientists at Macy’s that are thinking about our most strategic problems, people would have thought you are crazy,” explained Chief Strategy Innovation Officer Justin MacFarlane at an investor meeting in June.

But the team has come together “very, very quickly,” MacFarlane said. “And the real power of data and data analytics is focusing those resources and that talent on the core business.”

Source: Bloomberg.com

Canadian Tire Outperforms Analyst Expectations in Q2

Canadian Tire posted its second quarter results this week, beating analyst expectations. Revenue rose 2% to $3.4 billion from $3.3 billion last year. The DIY retailer’s shares rose from $2.46 per share to $2.81. April and May results did not help the quarter, mainly due to weather and the effect on seasonal products. However, Canadian Tire used analytics to diversify their product assortment and plan effective promotions.Canadian Tire Exceeds Analyst Projections

The retailer also invested in its website and mined customer data and data insights to respond to activity based on facts rather than intuition. Using these analytics, they better planned for flyers, loyalty strategies and promotional events. Same-store sales were up 1.4%. They also drove their private label products, which now is responsible for 1/3 of the retailer’s revenue. Sales of private label merchandise grew by almost 8%. Private label brands for them include Mastercraft tools, Norma lights and Canvas home goods. These products are performing so well that the retailer is considering selling them outside of Canada.

Source: Calgary Herald

Consumers Will Shop In-Store During Back-to-School Shopping Season

The International Council of Shopping Centers’ (ICSC) annual “Back-to-School Spending” survey revealed good news for brick and mortar retailers earlier this month. Consumers are in search of the best back-to-school deals and promotions and are hitting their local shopping centers to find them.

This year, 89% of consumers will make their back-to-school purchases in local shopping centers and malls. A vast majority (69%) will shop at discount stores, followed by office supply stores (37%) and department stores (32%). Physical interaction with goods is the top reason for back-to-school shoppers to visit stores. Most important among these shoppers are:

  • The “ability to see, touch, or try on the merchandise” (46%)
  • The “ability to browse/ease of buying specific items” (36%)
  • The “convenience of one-stop shopping” (35%)
  • “Avoiding shipping fees” (34%)

Parents of children in K-12 are expected to spend an average of $309.60 while those shopping for college plan to spend an average of $437.80. Many will wait to start their shopping until they see advertisements or sale prices in stores and nearly 90% said they’re influenced by promotions in terms of the amount they spend and the items they purchase.

“Back-to-school is one of the shopping seasons where we really find people looking for specific items at the best price,” said Tom McGee, president and CEO of ICSC. “Consumers are more informed than ever and research prices and products prior to making a purchase so it isn’t surprising that so many shoppers are waiting for sales and discounts before buying their back-to-school items.”

Digital will play a role as well, this shopping season. A majority of consumers (81%) will utilize their mobile devices while in-store shopping for merchandise. Among this group, 58% will compare prices, 39% will download digital coupons, 38% will check availability/inventory, and 30% will take pictures of items that might be purchased.

Source: Chain Store Age

Accelerated Analytics Visits the National Hardware Show

Scott Garber and Chad Symens at NHS with our newest clients, Acuity Brands

The annual NRHA (North American Retail Hardware Association) sponsored National Hardware Show in Las Vegas last week was another great tradition for our Accelerated Analytics team! Thousands of vendors displayed their product lines and future new releases in everything from paints and tools to lawn care and appliances. This was a great opportunity to meet with many of our customers who use Accelerated Analytics POS reporting and analysis for their Home & Hardware retailers such as Home Depot and Lowe’s. Of particular interest was our new ability to report on corporate Ace Hardware store and SKU sales and forecasting. We met with customers WM Barr, Calumet, Masterbuilt, Bercom and Stoner. We also met with our newest customer, Acuity Brands, who sell several lighting brands such as Lithonia Lighting and Juno.

The Accelerated Analytics team connected with vendors, customers, and attendees via their #DIYisOurSweetSpot contest that ran  from May 9th – 11th, during the hardware show. Entrants completed an online entry form and posted or tweeted about Accelerated Analytics to enter the contest. Three lucky attendees were drawn at random from among the entries to win hundreds of dollars in customer product prizes. Our third place winner was Tim Chin with RPE; second place was Jason Kane with Kane Enterprises; and our grand prize winner was Stephanie Cates with Rescue Pest Control. Congratulations to all three of our contest winners!

A common theme we heard at the conference was the heavy dependence on e-commerce sales and retailers. Many of the vendors we met who are new to the retail market are selling quite successfully on e-commerce sites and on Amazon. Many of these younger vendors, rather than starting out at Home Depot or Lowe’s, were making a name for themselves on e-commerce sites before getting that “big break” at the large corporations. Fortunately, the Accelerated Analytics reporting solution isn’t limited to brick and mortar stores. We are able to offer reporting and analytics for online retailers and currently work with online giants Amazon.com and Zappos.com, among others.

When asked what new, innovative products caught a lot of attention at the show, Accelerated Analytics Director of Sales and Marketing, Jennifer Freyer commented, “ I saw some amazing products that are coming to stores. Duracell and Hillman have partnered on keyless entry products that can provide auto key solutions for 91% of vehicles without needing to pay at the dealer. In the Lawn and Garden area, the WORX Landroid robotic lawn mower was demonstrating – I need that for my lawn!” The team also met with business partners Cleveland Research Group during NHS.

The National Hardware Show is an important event for Accelerated Analytics each year.

Do You Really Know How Your Products Are Performing?

Point of Sale Data

Suppliers count it as a win when they place a product line with a major DIY chain like Home Depot or Lowes. But understanding the details of how your products are selling can enable you to maximize your efforts and make the most of the typically slim margins you’re able to negotiate. The good news is that your retailers give you the information you need every week. But you need to use the right tools to turn their raw data into actionable insights.

Get the data

Major retailers routinely make their point-of-sale (POS) transaction data available to their suppliers, but the complexities of collecting and digesting it in a reasonable time frame get in the way of actually using the information. While some retailers use the standard EDI 852 format to deliver their weekly cash register data to suppliers, each retailer modifies the content of those files to meet their own needs. That means you need to convert the files to a common format before you can even start to analyze them. And some retailers don’t use the standard format, preferring to send spreadsheets or simply raw text files, further complicating the job of standardizing the data and readying it for analysis.

Look inside

The good news is that once you’ve cracked the code and converted all that POS data into information, you can look at trends and results from a variety of different perspectives. From a high level, the data can let you know what regions and which stores are selling each item. And analysis platforms like Accelerated Analytics  go even farther. According to Jennifer Freyer, Director of Sales and Marketing for Accelerated Analytics, “Suppliers can take advantage of different reports, easy to read dashboards, and geographic heatmaps. It’s easy to click and see where inventories are too high or too low, then drill down to store level for specifics. They can track promotions and see which stores are hitting or not hitting sales goals.” By using those kinds of tools you can decide to adjust your product mix to better allocate items that may be in short supply.

Make it a reality

Because POS data is delivered weekly, you can look at trends and predict item performance down to the shelf level in order to plan your recommendations to store buyers. But most vendors don’t have the time and technical ability to deal with the inbound data, much less the complexity of converting the various data files into a common format, then apply the analytical processes needed to produce easily understandable results. Fortunately services are available from experts in doing exactly this kind of work and can do the heavy lifting for you. They deliver a variety of reports that have been field tested and designed based on common issues suppliers face and they are customizable to meet the specifics of your business, products, and customers.

Suppliers can gain insights and help to direct their field staff to look for and correct conditions that can improve sales of their products, like improper placement on shelves. But of possibly more impact may be the ability to assist the retailer’s product managers with their responsibilities by proactively advising them on opportunities to make changes in product assortments, then track and report those results to show their effectiveness. Forward thinking suppliers are already taking advantage of the data their customers give them to sell more of their products.

Scott Koegler is a technology journalist with 20 years experience writing about business, computing and technology topics.

A Better Method for Evaluating Store Performance

Evaluating Store Performance

Last week I had an interesting discussion with my team about a customer whose focus is on improving store performance at their retail customers in 2017.  This customer is well represented with their entire product line at all doors at their key accounts, so they want to ensure each door is producing the maximum number of sales.  In our experience, brands selling products through retailers most frequently grade store performance using total dollars sold. The most common report shows total dollars sold by store for a rolling 4-week period, YTD and rolling 52 weeks. Stores with the highest total sales are assumed to be the “best” doors.  However, the top line sales figure doesn’t really give you the entire picture of store performance. The stores might have different assortments and inventory allocation can vary by store resulting in lost sales due to out of stocks. Total dollars sold is more useful when you look at a single SKU across stores, but in this case the goal was to choose one KPI for a door across all SKU’s.

Metrics you might use to determine store productivity include:

  • Total dollars sold
  • Sell-Thru %
  • GMROI
  • Inventory turns
  • Gross margin $
  • Average dollars per week per store

Let’s take a look at five stores and see which one is the ‘best’ store.   The table in Figure 1 shows the total sales for five stores over the most recent 52 weeks.  With a little sorting of our data by dollars sold descending we can add a store rank and identify that store 4758 is the “best” store and store 3529 is the “worst”store.   See Figure 2.

Figure 1

Store Number Rolling 52 Week Sales
4758 $738,394
3529 $457,938
7847 $627,348
5463 $584,393
2737 $495,494


Figure 2

Store Number Rolling 52 Week Sales Store Rank
4758 $738,394 1
7847 $627,348 2
5463 $584,393 3
2737 $495,494 4
3529 $457,938 5


Unfortunately, this is where the analysis of store performance all too frequently ends. Using total sales as the only KPI doesn’t provide any information on the financial return of inventory in the store. The sales could be very high, but the margins might be very thin, or even negative, and what appears to be a very high performing store could actually be unprofitable.

A better KPI for evaluating store performance is gross margin return on investment (GMROI).  GMROI tells you how much profit your inventory generated. For example, if your GMROI is 3.7 then your inventory returned $3.75 for every $1 dollar you invested into inventory.  A GMROI below 1 indicates you are losing money on every $1 dollar of inventory. For a refresher on how to calculate GMROI, visit our prior blog.

In Figure 3 we added the GMROI for each store and then in Figure 4 the stores are ranked by GMROI.    Notice store 4758 which was ranked number one based on total sales is actually fourth when you look at the GMROI. Store 5463 is creating $4.10 in profit for every dollar of inventory invested.

Figure 3

Store Number Rolling 52 Week Sales GMROI
4758 $738,394 2.7
7847 $627,348 3.2
5463 $584,393 4.1
2737 $495,494 3.9
3529 $457,938 1.7


Figure 4

Store Number Rolling 52 Week Sales GMROI Store Rank – TTL Sales Store Rank – GMROI
5463 $584,393 4.1 3 1
2737 $495,494 3.9 4 2
7847 $627,348 3.2 2 3
4758 $738,394 2.7 1 4
3529 $457,938 1.7 5 5


When you consider retailers invest 60% to 80% of their available capital into inventory it makes sense to use GMROI as the basis for evaluating store performance.  Here are some actions we recommend you take this quarter with your key retail accounts:

  1. Calculate GMROI by store.
  2. Calculate GMROI by brand by store.
  3. Ask your merchant for their GMROI target for your products.
  4. Do some research on GMROI for similar products.
  5. Create an exception report that highlights any store with a GMROI at or below 1. These are stores that need your attention.