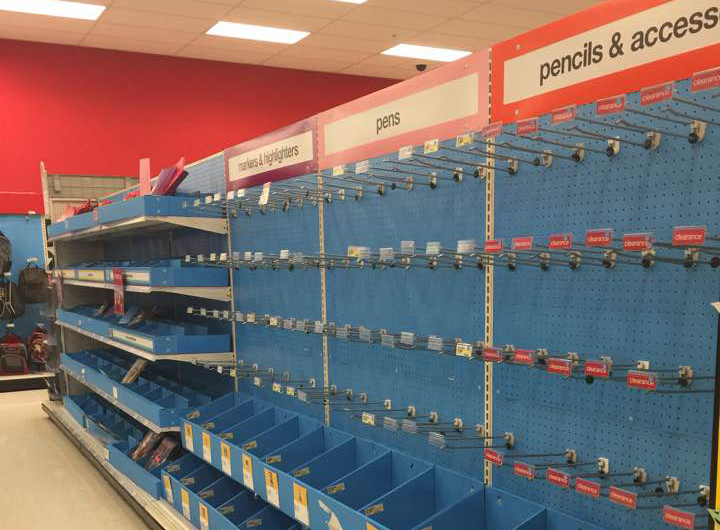
Probably three of the ugliest words for a retailer or vendor are — out of stock. Each and every time an out of stock (OOS) occurs, the retailer, vendor, and consumer lose. Revenues and profitability go down, and consumer frustration rises. This is not a newsflash; it’s easy to find a wealth of OOS research with a simple Google search. Thought leaders in the retail industry have been writing articles and funding research for decades to quantify the magnitude of the problem, diagnose root causes, and create solutions. The net benefit of all this work? Drum-roll please…. average OOS rates are holding steady at about 8% on average, with out of stocks for promoted items often exceeding 10%.
 According to a 2015 FMI/GMA Trading Partner Alliance Report, the problem is compounded by the growing importance of the user experience. Product availability is one of the top three reasons for where they shop, but during every shopping experience, one out of every 12 items on the shoppers list is not on the shelf. Additional data from the Grocery Manufacturers of America (GMA) and the Food Marketing Institute (FMI) Trading Partner Alliance shows an unsettling three-strikes-and-you’re-out pattern. A typical shopper will substitute another item on the first occurrence of an out-of-stock 70 percent of the time; on the second occurrence the shopper is equally likely to substitute, make no purchase, or go to another store; and on the third occurrence, 70 percent will go to another store. In addition to the potential for lost revenue from the out-of-stock item itself, there is also the potential for loss of future revenue streams from lost brand and/or store loyalty.
I recently had an opportunity working with a customer to help them quantify the impact out of stocks were having on their sales. We developed a Lost Dollars sold report which calculates the dollars lost by week for a SKU across all the stores at their largest retail customer. The report is pretty simple – it identifies every out of stock for a period of time, in this case the most recent four weeks, and then calculates the average rate of sale by store. Since the average unit retail price is known, we can calculate the estimated sales lost by looking at the units which would have been sold had the product been in stock, and multiply that number by the average unit price. The customer I was working with was shocked to see that out of stocks at their largest retail customer was costing them a little over $3,500 per week. That added up to about $14,000 for the four-week period we analyzed. The customer took our report to their replenishment manager, along with a recommendation to place an order sufficient to cover the next eight weeks of expected demand. The end result was an increase in sales of 3.5%!
We often have conversations with customers where they cite an in-stock rate of 99%. But, when you’re out of stock 1% of the time, the financial impact can add up quickly. The customer I referenced above was running at 99.1% in stock, and we still increased their sales!
Reducing out of stocks is a complex problem, with many moving parts and multiple parties that have to execute in harmony, or the entire system breaks down. But, you can’t manage and improve what you are not measuring. And it’s hard to believe a vendor is making an effort to reduce OOS if they are not measuring on-hand at their retail customers. If you are a vendor dependent on a retailer maintaining good shelf availability to grow your sales, then you need to proactively manage in-stock. That means, if your retailer makes POS activity available at midnight Sunday, your team should be taking action by 11:00 am Monday morning. Not just loading data into a spreadsheet, so they can start the analysis process. Or worse yet, not even receiving any data at all. Timely reporting and analysis on your in-stock and out-of-stock data across your retailers is a proactive step toward battling that steady, average out of stock rate of 8%.
For additional information, download out whitepaper titled Out of Stock Analysis available in the resource center.
Related posts