Author: Chad Symens

Understanding EDI 852 Data

What is EDI 852 Data?

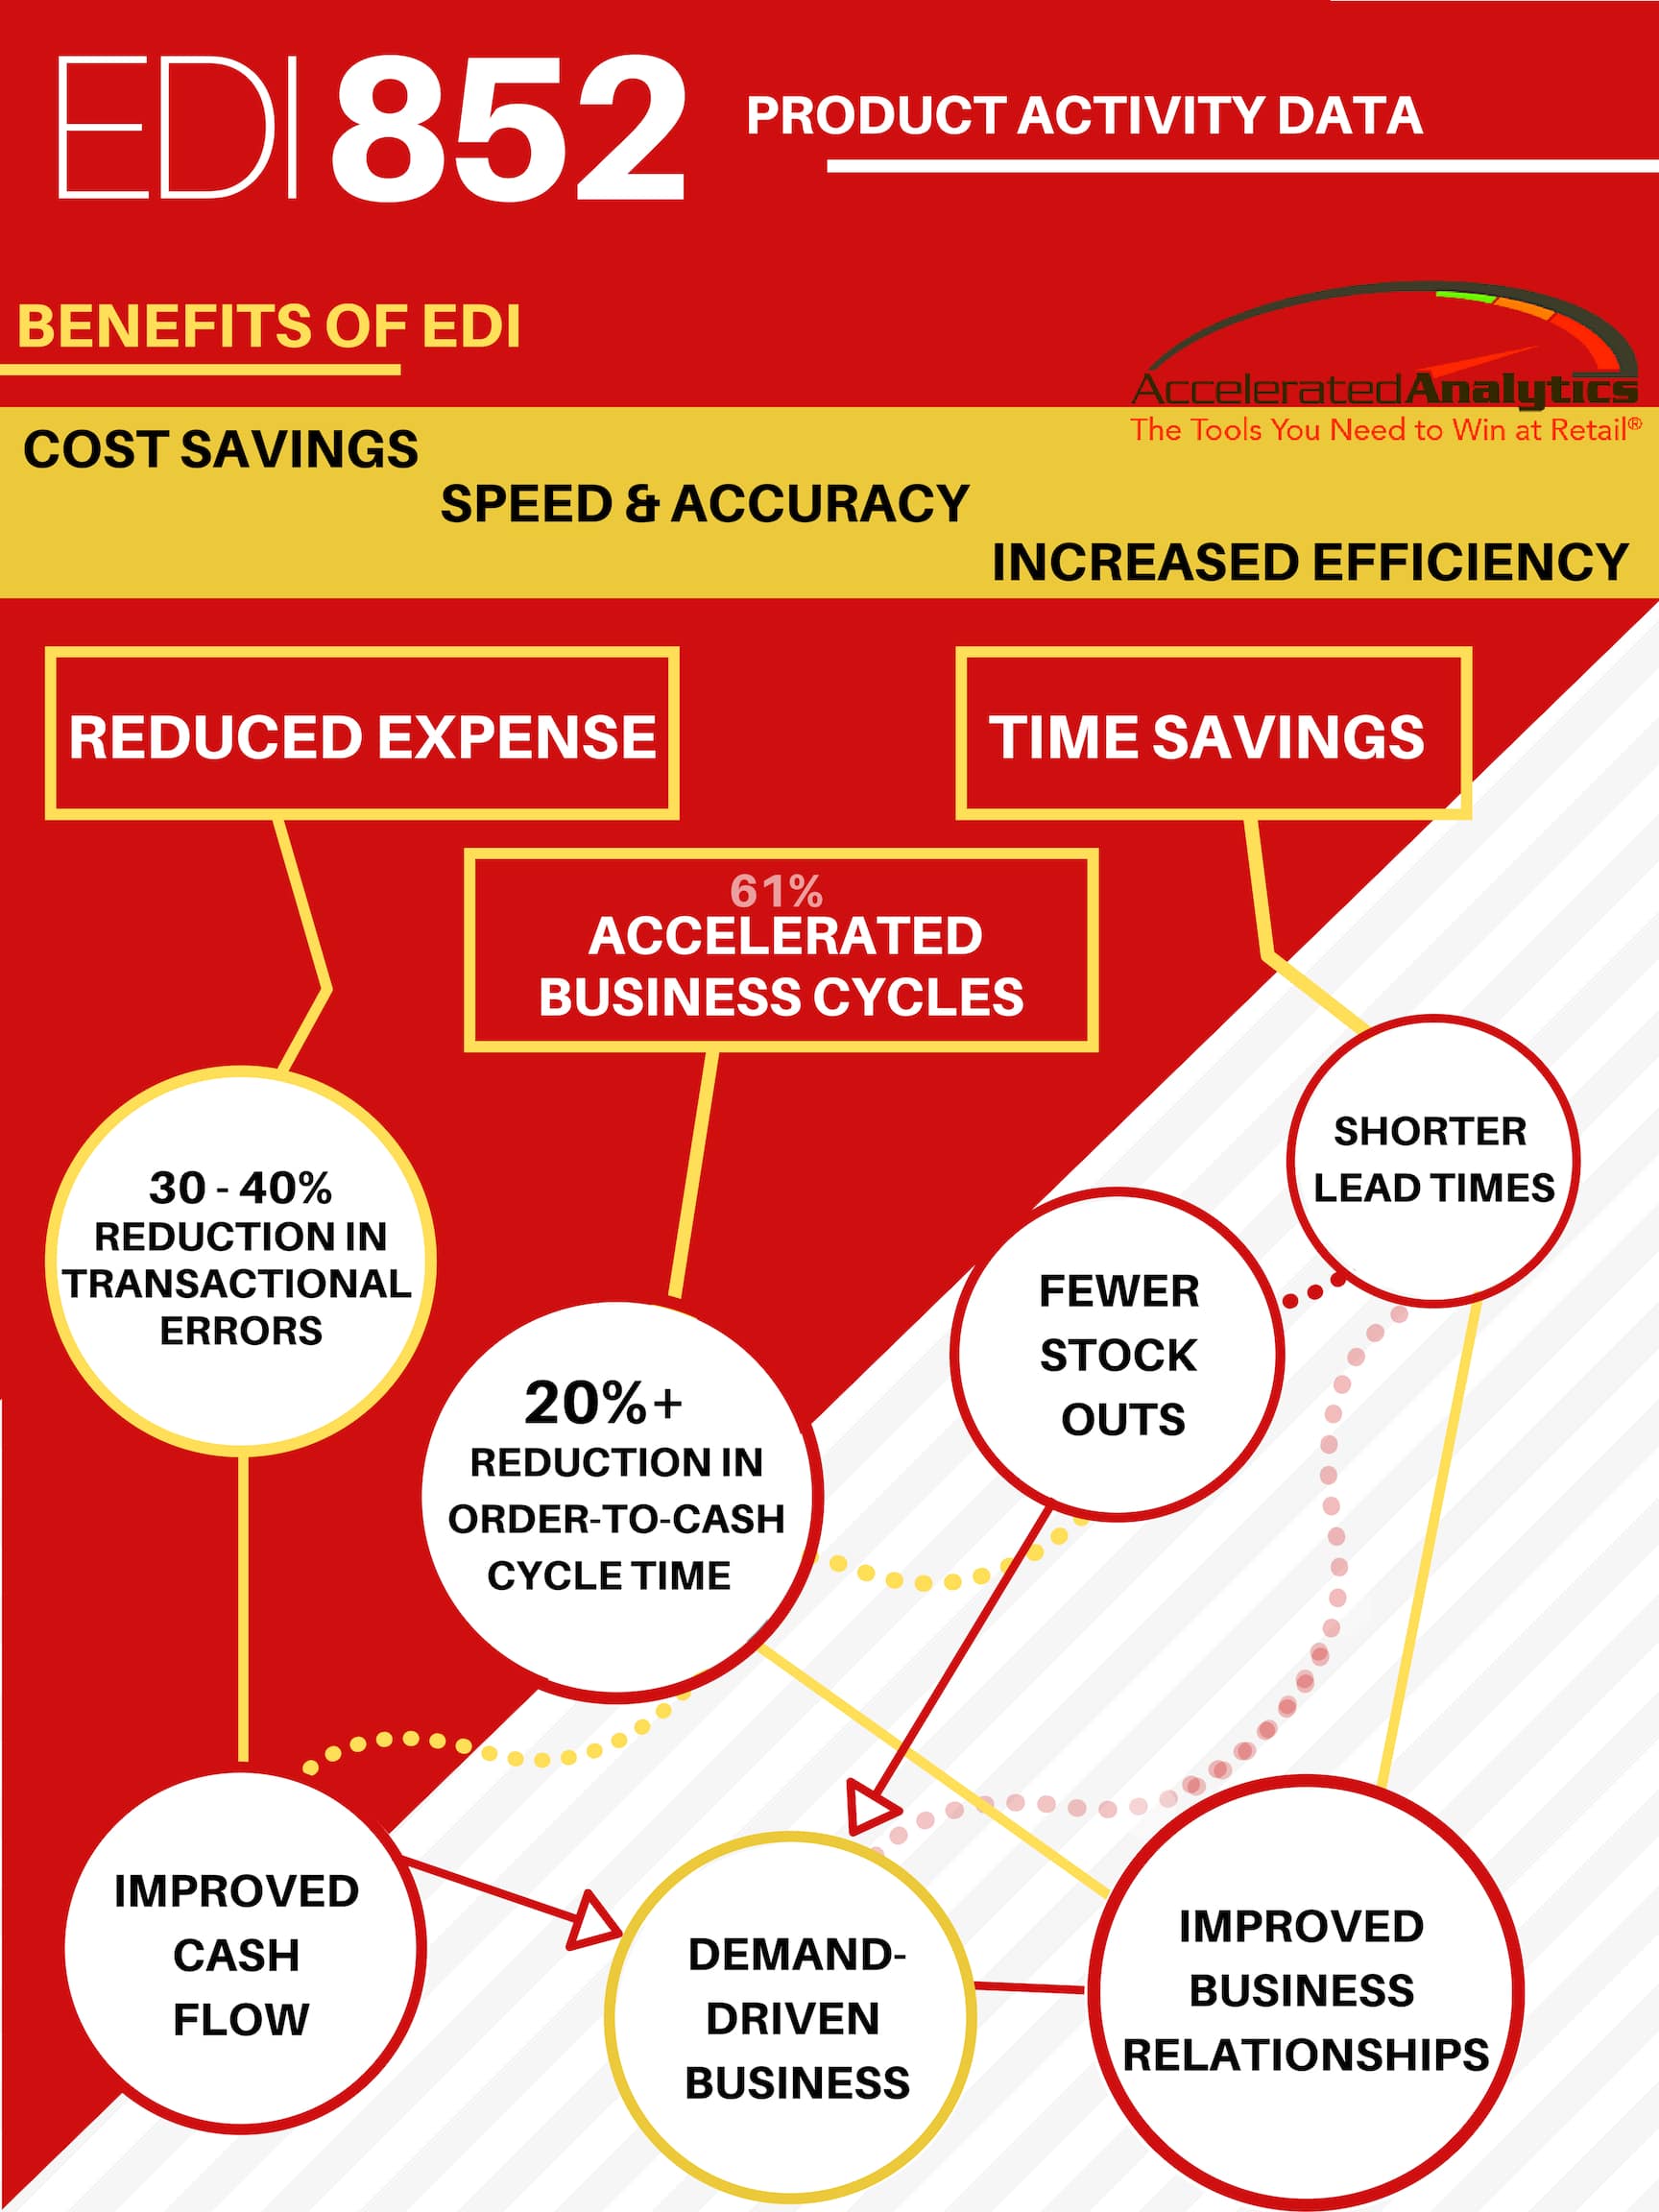
There’s a number of benefits retailers can gain thanks to their EDI 852 data. Just in case you don’t know what EDI 852 is, let us explain it like this. EDI 852 files are usually referred to as “product activity data” or “product activity report.”

A product activity report (EDI 852) is a document that highlights on 2 core factors:

  • It provides data on current products and inventory
  • It shows how products are selling – Point of Sale or POS data

Now, while there’s a lot of data and insights you can get out of your EDI 852, the core data points are going to be;

  • Item and Quantity sold in dollars
  • Item and Quantity sold in units
  • Quantity on hand (inventory)

EDI 852 data files are typically provided on a weekly basis.  The challenge is that each retailer uses a slightly different format, data descriptions, and code identifiers. This is why it’s difficult to estimate exactly what you’d need without having a conversation with you first.

None the less, EDI 852 files routinely contain the following information:

For each item

  • Item description
  • Item UPC

Data can be summarized by:

  • Store
  • Distribution center

Key product activity measures:

  • Quantity sold ($)
  • Quantity sold (units)
  • Quantity on hand ($)
  • Quantity on hand (units)
  • Quantity on order ($)
  • Quantity on order (units)
  • Quantity received ($)
  • Quantity received (units)

Key forecasting measures:

  • Quantity ($)
  • Quantity (units)

Key retail metrics which can be calculated to evaluate performance against your goals:

Working efficiently with EDI 852 data requires a good analysis tool like Accelerated Analytics®. Otherwise, the merchandise planner is left to sort through line after line of data to find problems and opportunities. By using Accelerated Analytics®, the routine tasks of formatting and consolidating data are eliminated, and exception logic can be used to save time.

The Accelerated Analytics® team understands how to work with EDI 852 data. We eliminate all the headaches and give you the preformatted reports you need to run your business.

Supply Chain Analytics

Retailers and vendors in today’s retail market face the unenviable challenge of reducing costs and maintaining margins, despite falling overall sales and slow-to-recover consumer demand. One of the areas in which retailers are pushing back onto vendors, is inventory management, which for vendors too often translates into retail partners that reduce overall inventories and require tightened delivery deadlines.  Retailers view the supply chain as one of the key places in which costs can be reduced—or better yet, passed off onto someone else—as a means of keeping shareholders happy despite reduced POS sales.  Wal-Mart continues to set the pace in this area, reducing its overall inventories across the board, reducing its brand assortments, adjusting its purchasing methods and imposing tough penalties on those that miss their Must Arrive By Date (MABD).

Thus, the impetus has fallen to vendors to manage their supply chains more efficiently, so that the cost-savings being realized by their retailers’ inventory adjustments might trickle down to them as well, instead of becoming a proverbial albatross.  And while the “glass pipeline” may remain elusive, industry experts postulate that, “Visibility of supply chain costs have never been better.” Since, then, there remains continued pressure on everyone in the industry to reduce costs, there exists an opportunity now to address supply chain optimization unlike any time before.

As in all such processes, the first step in addressing this optimization is identifying the major challenges, which while not simple by any means, can be boiled down to three major focal points:

  1. Reduce supply chain costs
  2. Improving the responsiveness of the supply chain
  3. Managing demand volatility and Variability

From an IT perspective, there are things that can be done with the data already being generated or received by most companies (even small ones!) to address some significant portion of each of these.

Reducing Supply Chain costs

While the operating costs of a supply chain are often the easiest numbers to point to and the most difficult for IT to address, there are data sources that can be leveraged to reduce costs.  For example, purchase orders, shipping data, and RTV (return to vendor) data is either generated internally or is received from retail partners (sometimes in a very straightforward EDI 812 document).  Unfortunately for many companies, these data sources come from disparate business systems and are stored in multiple locations, so tracking a single PO from the time the order was received through the supply chain to its delivery at a store or in a DC is an arduous task requiring proficiency in Excel and fraught with the potential for human error.  Further, when compounded by the volume of orders received that many vendors keep up with, the task of tracking becomes futile, since the actionable information it generates rarely is identified in time to take the given action, but rather is often merely a confirmation of what has already been made known by the retail partner that fined the vendor the late delivery or shorted pallet.  Thus, the lost efficiency of the analysts and the fees assessed by the retailers become additional costs in too many cases, and analysis of this data is simply not conducted.  However, those vendors that are able to aggressively track this data and address issues that may arise in a timely manner can avoid fees and improve their relationships with their retailers.  Unfortunately, upper management often struggles to see beyond the concrete costs figures and consider these less concrete but no less important opportunity for increased revenues or avoided fees.

Improving Responsiveness and Managing Demand Volatility and Variability

The delayed turnaround inherent in the difficulties discussed above relate directly to improving the responsiveness of the supply chain.  That is, supply chain utilization must address two areas of responsiveness:

  1. Responding to existing issues
  2. Responding to potential issues

Existing issues, as already discussed, are difficult to ID due to the disparate sources of data and the corresponding amount of time it takes to collate the information and determine what issues actually exist, since addressing existing issues is time-sensitive.

Potential issues are no less difficult, since these are often identified by considering all the aforementioned data sources and then including additional data sources such as POS data (from which forecasts are derived).  Mike Griswold, VP Retail for AMR Research, says, supply chain optimization “involves better forecasting methods and moving away from looking at warehouse shipments and toward POS and online sales data.” He goes on: many vendors fail to utilize POS data effectively for addressing supply chain issues because “it’s easier to get your arms around warehouse shipments because you’re dealing with weekly or twice-weekly sources of data.  When you get to POS, you’re getting down to day-level granularity for items and stores, and creating a forecast for three or four weeks out requires a fair amount of processing power.”  Of course, Griswold qualifies his position—forecasting based on POS and other data sources isn’t the final step.  “Retail is not designed to be an inventory holding area,” he says. “You may [get] an order for 1,000 televisions to be deployed across 100 stores, but not every store can handle 10 of each item.”

Thus, forecasts must be based on actual POS historical sales, current trends, other considered supply chain factors, and tempered by the limitations of the stores for which the forecasts are generated.  Retailers provide a shelf-space and assortment designation (called plan-o-grams, modulars, sets, etc.) for most vendors which allows vendors to consider these factors when filling orders, and combined with their own warehouse quantities and capacity, now a very comprehensive and useful picture emerges, from which one may then deduce those potential issues and act to address them, instead of reacting after they become a time-sensitive emergency.

How Accelerated Analytics®  Can Help You Optimize Your Supply Chain

Unfortunately, University of Pennsylvania professor of Operations and Information Management Marshall Fisher says the industry trend for vendors faced with the decision to have too little inventory and lose sales or have too much and be forced to liquidate leans toward the former. “Most companies are just moving along with less inventory. They are downsizing to meet less demand and accepting higher stockouts. The risk of a lost sale is smaller than having lots of unsold inventory.”

But what if you had an integrated database solution that tied all of the disparate sources of data together into a single source of truth, from which actionable decisions could be made on timely, comprehensive data? The Rainmaker Group™, creators of Accelerated Analytics®, was first a business intelligence (BI) company and its expertise in BI solutions can be leveraged to create such an integrated database behind the Accelerated Analytics® interface, creating a powerful yet user-friendly tool that business users need and which management can understand.

Advantages offered by Accelerated Analytics®:

  • Integrated database to tie together all your data sources (P.O. files, Shipping documents, POS data, Plan-o-gram files, and more!) in a single location from which may be derived a single source of truth.
  • User-friendly reporting solution which provides rapid access to any of the data in the system and reduces the overhead normally associated with the collation and calculation of data
  • Exceptions reporting to identify shipping delays, stockouts, etc. automatically as often as required.
  • Proven forecasting methodology to generate proactive forecasts based on actual sales and inventory information

Calculating the cost of out of stock’s

Vendors know an out of stock or empty peg is a very bad thing, so it’s hard to understand why most vendors are not managing their retail sales at a store and item level. Here is what we calculated for a vendor this week to estimate their lost sales due to out of stocks. The results were pretty eye opening.

This vendor has 4 retail customers. Retailer 1 has 3,600 stores, retailer 2 has 2,500 stores, retailer 3 has 1,800 stores and retailer 4 has 950 stores. Total retail stores = 8,850. Average in-stock % across all four retailers = 98% so approximately 177 stores are out of stock each week. Weekly unit sales for their top selling items average 6 per week so approximately 1,062 unit sales are being lost each week, which is roughly $15,000 in lost sales per week.

In other words this vendor is loosing over $750,000 per year in sales.

Partnering with Walmart

There are no shortage of articles on Walmart in today’s press. Some are positive, but many are written from a viewpoint of fear. Here are some interesting facts from a recent article titled “The Elephant in the Room” by Greg Buzek, which was printed in the May 2007 RIS News. The article paints the picture of just how large and dominant Walmart is in just about every category. For example, the article notes Walmart’s average monthly revenue is $28.3 billion, which is greater than Federated’s average annual revenue. Retail Forward predicts in 2007 18% of every food dollar will be spent in a Walmart store, and that includes restaurants. Overall, Walmart is the number one super center, grocer, drug store, electronics store, office supply store and furniture store.

So, if you are a Walmart supplier, or if you want to be, the key question is how do you partner with an organization as large as Walmart? The answer may be your organizations ability to analyze point of sale data. Walmart has invested heavily into information systems and a trading partner portal called Retail Link. As an approved Walmart vendor, you can access near real-time data on how your products are selling and stocked at every Walmart store. The trouble for many vendors is the complexity of extracting the data and then analyzing it can be a huge challenge. We work with vendors that have pulled 100 megabyte plus files from Retail Link only to realize they have no suitable tool to analyze the data. If you are in this category, the first thing to realize is Retail Link was designed to give you access to the data, but it was not designed to help you analyze data. For that, you need to invest into tools capable of doing difficult data crunching. Data files of this volume require a database and sophisticated reporting tools. Most vendors tell us this is a good candidate for outsourcing due to the cost of acquiring the technology and the engineering complexity.

Analyzing Walmart data is a key success criteria for vendors because Walmart expects vendors to proactively partner in avoiding out of stock situations and increasing sell-thru. The first thing to do is engage an outside service for POS analysis. Walmart data files are large and will require a good database to store and analyze. You will want to capture and store history, so you are going to need a good amount of disk space. Next, make sure you have access to good reporting tools. A spreadsheet is not going to cut it. You simply cannot analyze sales and on-hand data from over 3,000 stores in a spreadsheet, in any reasonable amount of time each week. Unless, of course, you have unlimited time. After you have the tools in place, start with the three most important measures: unit sales, on-hand, and sell-thru at a store level. If you can get a handle on these three performance indicators, and then put action plans in place to improve, you are well on your way. Monitor these each week and get to know which stores are having sell-thru issues. Look for patterns in the data, like chronically out of stock stores, or very slow selling items. Finally, communicate with your buyer(s). Our experience has shown they are very open to vendor initiated conversations. Especially when the vendor has quality reports with accurate data from Retail Link.

Analyzing Walmart Retail Link POS Data

If you are a Wal-Mart vendor, you have access to a wealth of data via Retail Link.  As a service provider, we work with a lot of Wal-Mart vendors, helping them to analyze the point of sale data made available by Wal-Mart through Retail Link.   Sometimes a vendor will ask us “If I have Retail Link, why do I need to hire someone to help me analyze POS data?”

Retail Link provides a method for getting POS data, but as the vendor, you will be responsible for transforming the data and you will need a database to store the data.   Both of these are critical to provide for comp week and comp year comparisons, which are the basis for accurate and insightful POS analysis.  The complexity of building a database to store Retail Link data is more than most vendors want to bite off, since it requires hardware, software, and IT skills to accomplish.

What can you do with Retail Link data if you have it stored in a database?

·   Analyze SKU/store level sales

·   Analyze SKU/store level on hand

·   Analyze average unit selling price by SKU/store

·   Analyze plan-o-gram compliance by verifying on hand and selling at traited and valid stores

·   Identify out of stock stores, and even forecast demand based on prior sales

·   Create SCRIPT forecasts for your buyer indicating where inventory is needed to maximize sales and avoid out of stocks.

·   Group stores into A, B, C categories based on SKU level sales volume. 

Wal-Mart buyers expect vendors to use Retail Link data to analyze and manage their SKU activity.  If you are not already using the data, of if you are not using it as well as you could be, then you are missing sales opportunities.  Don’t wait for your buyer to call you and ask a question you can’t address – start working with the data today. 

Calculating Price Elasticity

Show of hands, how many of you know how to calculate price elasticity?

Well, if you are like me, you know the general concept but the math is a bit rusty. So, here is a quick and dirty refresher. Price elasticity is a measure of how demand for a product is influenced by price changes. This measure can help determine whether to change the price of products by calculating what effect price changes have on the quantities customers purchase.

Price elasticity can help to answer questions like: If I increase my unit price by 20%, how much unit sales volume will I lose? If I lower my unit price by 10%, how much unit sales volume will I gain?

To calculate the price elasticity (PE) PE = [(Q2-Q1) / ((Q1+Q2) / 2 )] / [(P2-P1) / ((P1+P2) / 2]

Where Q1 = initial quantity; Q2 = final quantity; P1 = initial price; P2 = final price

Understanding the calculation results:

If the PE > 1, the product is relatively elastic.  An increase in price would result in a decrease in revenue, and a decrease in price would result in an increase in revenue. If the PE < 1, the product is relatively inelastic. An increase in price would result in an increase in revenue, and a decrease in price would result in a decrease in revenue.

Calculating Sell-Thru

Retail Sell-Thru

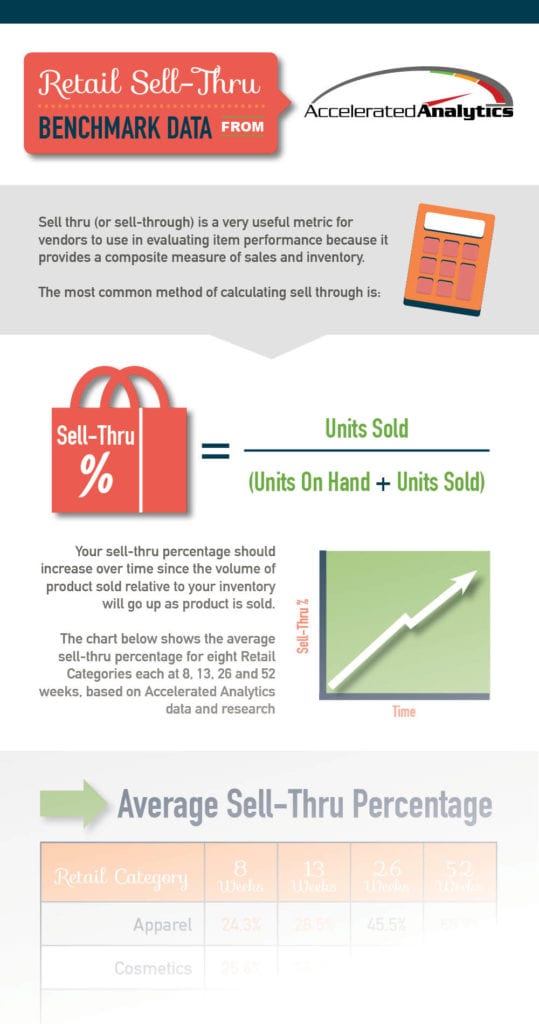
Sell through (or sell-thru) is a very useful metric for vendors to use in evaluating item performance, because it provides a composite measure of sales and inventory. But like many business measures, there is more than one method of calculating sell through.

The most common calculation is: Sell Thru % = Units Sold / (Units On-Hand + Units Sold). Sell thru is typically evaluated on a daily basis for fast moving products or weekly for slower moving or replenishment based products.  A higher value is better, indicating your sales velocity is good and your inventory is appropriately forecasted. If sell thru is low, this indicates either poor sales or too much inventory. In most cases, sell-thru for an item is compared in recent periods like current week and last week, as well as in aggregate across several months or even a year.

When evaluating sell-thru, it is also useful to group together products which have been selling for a similar period of time and/or which are sold into the similar store types. For example, comparing sell-thru for a product with 5 weeks of selling activity against a product with 20 weeks of selling activity most likely will not produce a useful comparison. In the same way, comparing sell-thru for a product in a group of stores in a highly affluent area is not likely to compare favorably to a group of stores with a low income level.

Most retail buyers have a set sell-thru percentage they use to judge vendors based on product category or department.  It is important for vendors to discuss the sell-thru expectations with the buyer in order to align with those objectives.

For reference, we’ve compiled sell-thru percentage data that you can use as a benchmark.


Create The Perfect Store Walk Report for Your Merchant

The strategic importance of walking a store with your retail merchant has been growing dramatically in the last several months.  Retailers like Home Depot and Wal-Mart are putting a strong emphasis on merchants spending more time in stores, so they can see firsthand the product presentation and get the pulse of what is happening at stores.  We have been told some retailers require merchants to spend a minimum of three days per week out of the office walking stores.

This creates a great opportunity for smart suppliers using point of sale analytics and reporting to drive high quality store walks and get the merchants to focus valuable minutes on their products on store walks.  The purpose of this article is to explain how you can grab as many of those minutes as possible.

First you need to create a store walk report.  The Accelerated Analytics store walk template includes the following elements:

·  Total store sales performance in dollars including rolling 52 week sales and prior 52 week comp, YTD sales and prior year comp, MTD sales and prior year comp.

· Store ranking based on total sales performance compared to stores in close geographic proximity.  If the retailer has BYO’s or Markets, like Home Depot, use those, if not, then use state and city.   We find it is best to present the ranking in terms of X out of Y.

·  8 week sales trend

·  Top 5 SKU’s and bottom 5 SKU’s based on unit sales.

For each of the top and bottom SKU’s, we include an image of the product along with the SKU and description, so the merchant can easily identify the product without having to go and read tags.  For each SKU, we also provide all the key metrics about that item including: rolling 52 week sales, YTD sales, last 8 week sales and comp year performance for each.  We include current on hand, weeks of supply and sell-thru.  Finally we rank that SKU based on sales performance among all the suppliers SKU’s sold in the store.

After you have created a store walk report, the next task is to get with the merchant so you can review and enhance the report based on additional metrics they want to see when walking the store.  By doing that, you not only end up with a report that is customized to their needs, but you also get their buy-in to use the report.  Essentially, you have created an indispensible tool for them and they will want to use it.  After the report is created, touch base with them frequently to find out what stores they will be visiting and when,  and then either send them the report for those stores or offer to tag along and bring the reports with you.

Our Accelerated Analytics customers have even taken the store walk to the next level using our iPad mobile access.  They are walking stores with the merchant, iPad in hand, and viewing the report in real time as they walk the aisle.

Many suppliers have become familiar with using point of sales reporting and analytics that is based on EDI 852 or retailer portal data, but taking it to the next level and creating targeted reports like a store walk report is where the value is really seen.  With a great store walk report, you can provide your merchant with the critical information they need and differentiate your company.  It’s a power tool that you need to add to your arsenal.

Even Simple Forecasting Can be High Value

Forecasting is part mathematics and part art, and due to this,  it can be extremely complex, but even simple forecasting can be very valuable.  Many vendors get too tied in a knot over the complexity of item and store level forecasting and then nothing gets done.  We encourage all vendors to start with the basics and increase the sophistication of your model over time.  Forecasting will provide you with critical information necessary to avoid stock outs and maximize your retail sales.  And if you do it right, you can gain a critical advantage over your competition and demonstrate to your buyers that your company is working hardest to be a good partner.

There is a simple process for forecasting.

1.   Sum the units sold for the most recent 5 weeks.

2.   Sum the units sold for the same period last year.

3.   Calculate the percentage change in units sold.

4.   Sum the units sold from the current week forward 16 weeks last year.

5.   Adjust the 16 week total to current year demand by multiplying times the calculated percentage change.

6.   Divide the adjusted 16 week units sold by 16 to get an average weekly forecasted units sold.

7.   Calculate a weeks of supply on hand by dividing the current on hand by the weekly forecasted units sold.

The forecast can be customized to your business by adjusting the base for the foundation (5 weeks above) to be longer or shorter depending on how heavily seasonality or promotional activity affects your sales.  E.g. shorten the period if your business is highly seasonal and lengthen the period if your business is primarily replenishment with little variability.  You can also adjust the current on hand value by adding any in transit inventory so you don’t overstock. 

Now that you have a good idea of the forecasted weeks of supply, you can use this value to make inventory production decisions.  Each vendor’s lead time to produce and land product at a store will vary, so you will need to determine your target weeks of supply and take appropriate action.

Vendor Managed Inventory (VMI): the Holiday Season

September 2 articles in the Wall Street Journal and the Chicago Tribune warn of potentially mild holiday buying driving inventory trends in major retailers across the country.  The chief concern cited in both: fear of too much inventory when the season ends and the resulting “frantic price slashing” (Tribune) and “discounting bloodbath” (WSJ). The Journal article cites slow back-to-school shopping as a harbinger of slow holiday sales and the Tribune goes on to quote a supply chain management expert as characterizing many retail locations as “zombie stores” regarding their dropping inventories.  “At best,” he says, “a store like that looks boring. At worst, it’s a struggle to get people to come in and buy product.”  This fear of clearance selling due to slow sales projections has retailers reducing the “breadth and depth of their assortments” going into the holiday season. 

For retailers, this trend is actually helping their numbers, keeping investors happy.  The Tribune reports that mainstream department stores and large discount chains actually improved their gross margin bottom line in the second quarter over last year (the notable exception being Macy’s).  But this trend can be bad for retailers, and the Tribune correctly notes that fickle, unhappy shoppers will just as soon go to another store to get what they want than buy the next best thing on the shelf. Further, Perry Ellis CEO George Feldenkreis says, “Inventories have been very depleted at retail and retailers are going to find themselves in a situation where some of them, if sales just improve a little bit, are really going to be out of inventory and they are going to be chasing inventory.”

What this means for vendors is that, among other things, it underscores the need for vendor managed inventory (VMI).  Given the current retail inventory trends and the projected trends for the holiday season, it is absurd for any vendor to think that they will be able to sit passively and wait for an order to be placed by their retail partners.  Rather, the vendor that supplies the most similar product to the need and can provide it most rapidly will be filling the voids this season, because the last thing that a retailer wants in this environment is to have an order need to be filled the next day and arrive three weeks later, too late to sell most of it, so that the lion’s share of the order ends up on a clearance rack.

So how does a vendor manage their inventory so that they can meet inventory needs at their retailers without too much cost for themselves?  Rainmaker has identified four key indicators that should be tracked:

  • Out of Stock Stores

    Stores with no items on the shelf cannot sell those items, and the longer they sit without sales, the less likely the retailer will be to re-order them in light of the industry trends.  However, take care not to overstock those stores by checking the sales trends for the last several weeks that the store did have inventory and the same period sales the previous year.  It stands to reason that sales will be down slightly over the previous year for most items, so reconcile that against the preceding several weeks and resolve stock outs immediately. 

  • Under Stocked Stores

    Current sales trends and same period sales the previous year combine to provide a valuable barometer for sales in the near future.  Consider these and identify those stores with too little inventory to meet anticipated demand, and bring them back up to minimum required amounts of inventory to meet the short term demand, lest they end up in the out of stock category.

  • Warehouse and DC Inventories

    Not all retailers distribute their products the same way, so knowing how the distribution of products works, and considering the general or store-specific inventories sitting in warehouses and distribution centers for retailers, will help prevent overstocking or overproducing products that may not be on a retail shelf, but might well be on a warehouse shelf or already on their way to a retail outlet.  Sum up item-level needs to resolve out of stock and under stocked stores to their associated warehouse or DC to prevent over-producing or over-shipping. 

  • Gross Margin Return on Investment (GMROI)

    MSRP is a fine concept, but more often than not, it isn’t a true gauge of what an item is selling for.  Additionally, shipping items to one retailer or store has different associated costs than to ship to a different retailer or store.  Calculating an average selling price for an item for each retail partner, and combining that with cost and inventory levels, allows one to identify which retailers are generating the highest gross margin return on investment. Further, as retailers reduce their assortments, key in on the items with the highest GMROI and allow the others to fade out.

To track these indicators, it is essential that it be done at an item/store level if buyers are going to take the vendor seriously and relinquish any control over the ordering process.  Managing inventory at this level can be difficult, especially for smaller vendors whose budget and resources are limited but whose retail partners are many.  Simply receiving, storing, and analyzing the vast amount of information required to track these indicators often requires whole departments, which are even then most often understaffed and overworked, degrading the quality of the answers they provide. Accelerated Analytics offers a comprehensive solution to these needs that culminates in a set of intuitive, business user-friendly reports that allow a vendor to begin analyzing data within hours of the arrival of data from a given retailer, rather than burning the lion’s share of time collating and formatting the information and only briefly analyzing it before it becomes stale. For a fraction of the cost of the overworked and understaffed department that attempts to handle these needs now, Accelerated Analytics’ solution can automate and improve this process dramatically. To see how Accelerated Analytics can assist in the resolution of your stock out and under stock troubles, request a free stock out exposure analysis or contact us today!