Author: Chad Symens

Sears to Unload Stores

Hedge fund manager Edward Lampert announced Thursday he intends to sell off some 1,200 Sears stores in an effort to raise $770 million in cash.   Some are looking at this as the start of a breakup and a reversal on the past seven years spent trying to integrate Kmart and pull the company out of the doldrums.   Sears plans to sell off 11 full line stores to General Growth Properties, 1,061 hometown stores, 116 outlet stores and 96 hardware stores.

The 126 year old brand has been losing market share to Wal-Mart, Macy’s and Home Depot for many years as it struggled to find an identity in a competitive market and seemed to confuse consumers with its marketing messages.   But Sears still has some very strong brands like Craftsman, so it’s not impossible to think with a cash infusion and some improved merchandising and marketing, they can turn it around.  Among our customers who we provide Sears POS reporting for, they are in some cases realizing strong sales, in particular hardware and apparel basics.

So what are your thoughts?  Beginning of the end or can Sears turn it around?

U.S. retail sales rise solid 0.4% in January

Is it just me or does the economy seem to be inching back?   Retail sales are rising and are significantly up from the recessionary lows.  See details at retailingtoday.com article “U.S. retail sales rise a solid 0.4% in January”.  We have also noticed an increase in the number of new customers signing up for our POS reporting services as they seek to make strategic investments to drive their business.  Investment is a great sign – it means business leaders are feeling more confident in the economic outlook.  Inventory management and protecting margins are still a challenge and accurate and timely POS reporting can help with both objectives.

What is your economic outlook?

Weather Analytics and Retail Sales

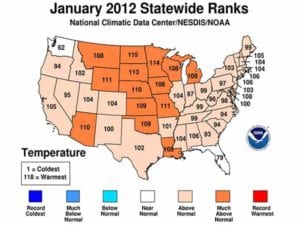
After crunching the numbers, the National Climatic Data Center (NCDC) has found that January 2012 was the fourth warmest January on record across the contiguous United States. This is also the mildest January since 2006, which was the warmest in records dating back to 1895.

States with a top 10 warmest January (9 total) – AZ, KS, MO, MN, ND, NE, OK, SD, WY

Weather can have a significant impact on retail sales.  Consumer’s behavior changes, distribution can be impacted, regular seasonal selling can shift, etc.   Our team has recently completed analytical projects with customers using precipitation, temperature, humidity, and many more weather data points to understand retail sales patterns and then use that understanding to create forecast models.  This is the beauty of store / UPC grain retail sales data.  Combining retail point of sale (EDI 852) demand data with weather data, you can identify fascinating and very useful insights.  Some things to keep in mind….

Useful weather analytics almost always requires day grain retail data.  Week grain data is useful for some weather analytics but there are significant limitations.  EDI 852 is often weekly grain, but sometimes day grain is available.  Portals like Retail Link can provide daily grain (or lower if you want) retail sales reports so target your project to your retail customers that provide day grain retail sales data.

Studying the data carefully to identify statistical significance is critical.  Antidotal or observational research is helpful to inform your statistics but be careful about over simplifying what you see (e.g. it rained and sales are up) until you have run the numbers.

Do apply your industry and product knowledge.  If you sell a product that conventional wisdom says is impacted by precipitation or temperature, then use that as a starting point for building the model.  If the output of the model challenges the conventional wisdom, then dig into the model and look for holes until you are satisfied with the accuracy of the results.

A quality weather analytics project is not an inexpensive project, so be prepared to make an investment.  But on the flipside, we have seen these investments provide huge returns for highly weather dependent product categories.  

Getting Your Buyer to Agree to A Test

Getting your buyer to agree to push order recommendations, modular changes, SKU assortment changes, etc can be a challenge.  Here is some practical experience on how to make it happen.

Running a test with your buyer can be a very effective way to ‘sell them’ on new ideas.  Many times our clients want to use our forecasting tools to push recommended orders to replenishment managers, but the replenishment manager is not receptive to adding extra work to their day and they certainly don’t want to risk overloading stores with too much inventory.   Many times our clients want to change the modular assigned to a store or SKU assortment within an existing modular, but again, the buyer is reluctant to make a change that could have negative results.  Proposing a test is a good way to limit their risk and overcome their concerns.  If the test is properly designed and the control group is selected to provide a proper comparison, your idea should receive a fair vetting.

I spent considerable time today helping a client build a list of stores for a modular test at Wal-Mart.  My client has modulars at Wal-Mart in the following widths: 40’, 36’, 32’, 20’ and 12’.  The SKU assortment grows based on the width of the modular, so a 20’ modular has all the SKUs of a 12’ modular plus some extras.  They have gained the agreement of their buyer to test 25 stores with a larger modular than the store would otherwise qualify for to see if the demand for their products is deserving of more square feet.   The test stores were identified by the buyer and are in close proximity to my client’s office, so they can easily visit the stores.  The test stores have all been promoted to 36’ modulars, which is larger than they had in 2009 and larger than they would otherwise be traited for based on their profile.  The task today was to identify 25 control stores so we can test the sales lift over an 18 week period.  To identify the control stores, the following information was pulled out of Retail Link: 2009 total units sold by store for all stores in my client’s home state.  The first thing we did was calculate the minimum, maximum, average, and median 2009 unit sales for the test stores.  We then eliminated all potential control stores which were not within the min/max, and then further narrowed our list by looking for stores that were +/- 20% of the median 2009 test store group unit sales.  All stores in the test group are Supercenters, so we then eliminated all stores under consideration for the control group that were not Supercenters.   The next consideration was the demographics of the test store group compared to the potential control stores.  We pulled a list of demographics for the test store group, using the store zip code for each of the 25 test stores, and looked at the following traits:  population density, median income, dominate race, and median age.   We created a profile using the averages for these traits.  We then cross referenced the possible control stores demographics along the same traits to identify the closest matches. 

The key is that by using UPC/store level EDI 852 or Retail Link data, the vendor is often in a better position to analyze the demand of individual stores and make recommendations to a buyer on things like orders, modulars and SKU assortment.  Store level planning is the holy grail of maximizing sales, but I’ve not met a buyer yet that has the time or resources to do that.   So the responsibility falls on the vendor to make it happen and proposing a test is often the way to get the ball rolling.

Vendor Questions on EDI 852

Frequently Asked Questions


Vendors are working hard to understand how to best use retail POS and inventory data, which is made available via EDI 852 or a web portal. Here are five very common questions vendors ask as they work with our team to put a data analysis solution in place.

What is the difference between EDI 852 and data available on my retail customers web site? The most obvious difference is the format of the data. EDI 852 is a standard document template but it is encoded using line identifiers and other language necessary for computers to make sense of the data. EDI 852 must be parsed and translated to be of any use to a business user. Data available in a retail portal is typically either presented on screen or saved into a text or spreadsheet format. These files do not require translation and can be opened in a variety of Windows programs. A second difference is the level of detail available. An EDI 852 document always includes units sold by UPC, but it may not include on-hand data. And receiving store level EDI 852 data is often an additional selection and cost. Most retail portals will provide detailed store level data files, or presentation of detailed data on the screen. Finally, and most importantly, EDI 852 values for each UPC can be different than the values reported in a file available on the portal. This can be due to different reporting periods, different source and/or additional source system data, or a different method of handling of returns.

If I can choose between EDI 852 and a file from my retailers’ portal which one should I choose? This decision comes down to a few factors. First, does the retailer charge a fee for sending data via EDI as opposed to accessing the data on the portal. Second, does the EDI 852 data provide less information than the portal. For example, as noted above, some EDI 852 files do not include on-hand or store level data.  Finally, research the data accuracy of the two sources and choose the one which will best support your decision making process.

What types of reports should I be using? There are three reports that form the backbone of retail POS data analysis: item sell-thru by store, inventory on-hand by item and store, and top selling items. From these three reports you can create a library of very useful decision support tools segmented by geographic region, product category, and by retail partner.

Why should I consider an outsourced service for POS data analysis? For most vendors, working with POS data falls outside their IT organization’s typical scope of expertise and tools. Simply put, there is a fairly large volume of data which requires translation, scrubbing, and organization into a sophisticated data warehouse. The data does not fit into most organization’s ERP, forecasting, or accounting system, so the IT department is faced with building a custom application. Then, end users need a simple and quick tool to access the data for analysis and decision making. An outsourced service can deliver the necessary engineering and software tools in a very short period of time without an expensive investment. And outsourcing provides a cost effective monthly expenditure which aligns with your cash flow instead of a large capital expense.

Why can’t I just use a spreadsheet for analyzing POS data? Spreadsheets have many limitations when it comes to analyzing POS data, not the least of which is simple row and column limitations. But more importantly, there is a significant amount of work required each day or week to accept, transform, format, and analyze data in an Excel spreadsheet. Time which your staff can avoid all together by using more sophisticated tools and/or an outsourced service. In addition, spreadsheets are generally not well suited for team based collaboration on data. Each time a spreadsheet is opened, the user has the opportunity to change/edit data which can rapidly deteriorate the quality of the data and cause significant duplication of effort.


Related Posts:

Understanding EDI 852 Data                POS Analysis & Reporting Made Easy                  Whitepaper: SKU Analysis
Managing Inventory: The Highs and Lows

When vendors think about managing inventory, quite often they immediately think of those stores with insufficient inventory and how to resolve that.  Of course, this is a natural and valuable consideration, and a correspondingly considerable effort is made to eliminate inventory outages and prevent lost sales.   
 
But what of the flip side of that coin?  A June 26th article in the Wall Street Journal, titled “Retailers Cut Back on Variety, Once the Spice of Marketing,” cites Walgreen Co., Wal-Mart Stores, and Kroger Co. as examples of how retailers are concerned about too much inventory in addition to their concern about too little.  The article goes on, “these and a few of the other largest retailers are expected to slice the assortment of products in their stores by at least 15%, industry executives and analysts say.”
 
The difficulty for vendors, then, is how to manage both the highs and lows of their inventory throughout their supply chain.  Indeed, inventory ought to be managed at an item by store level, which in and of itself is a vast amount of data.  This is further complicated by the use of third party distributors and the various distribution facilities and warehouse networks used by each different retailer.  Simply getting the raw shipping and inventory information from each retailer and/or distributor is often a substantial task, and making use of the disparate types and formats of data is more often than not the task of a whole team of analysts, who in turn rarely do any analyzing, spending the majority of their time collating and standardizing formatting.  As a result, by the time the inventory situation is discerned, it’s often stale data and virtually useless.
  
This need for accurate, rapid, actionable inventory information has caused vendors to turn to third party partners like Accelerated Analytics to quickly identify those items that are both under-stocked and overstocked.  The Accelerated Analytics® Inventory On Hand Exceptions report continues to be one of our most popular reports because it allows you, the manufacturer, to define any inventory exception you might be interested in and get a report for every item at every store that falls into that category.  Accelerated Analytics integrated use of data received from a vendor, its retail partners, and its distributors, allows our clients to see what the current inventory situation is as recently as the current Week to Date.  But more than the one-dimensional EDI files, Accelerated Analytics® provides a multi-layered inventory look incorporating your own warehoused, shipping history, your distributors’ warehouses and shipping history, and your retail partners’ warehouses and receipts, so you don’t push a new order to a store that is low today. but will be receiving a shipment tomorrow of several new cases for the same item.  Using this type of exception report, in addition to Accelerated Analytics unique Sales Velocity Analysis reports, your analysts can actually analyze your information and pinpoint the items and stores that need your immediate attention in time to do something about it.  This, in turn, will increase your sell-thru, which just might keep your item(s) on the shelf at Wal-Mart, Walgreens, or Kroger!

Explaining the demand driven supply chain

The demand driven supply chain is a retail optimization model developed and made popular by AMR Research. AMR defines DDSN as a system of technologies and processes that sense and react to real-time demand across a network of customers, suppliers, and employees. AMR benchmark research shows that those who do not implement supply chain improvement have an overall cost disadvantage of 5% of revenue due primarily to poor forecasting and in-stock performance. (see AMR Research Report “Hierarchy of Supply Chain Metrics: Diagnosing Your Supply Chain Health,: Feb 2004).

An article by author Enrique De Argaez summarized the main advantages of DDSN as: participants in the supply chain are all able to take part in shaping demand, as opposed to merely accepting and reacting to it.  Where vendors traditionally had little or at least latent visibility into market demand, the collaborative technologies employed in implementing DDSN have the overall effect of reducing and even eliminating the gap between upstream business and the end customers. This gives more accurate and timely insight into market trends which increases the accuracy of forecasting and supports better in-stock performance.

This type of market intelligence impacts more than just a vendor’s ability to plan operations; it translates directly into reduced inventory holdings across the supply chain, which in turn, means an overall reduction in the amount of capital invested and therein all the associated carrying costs.

Research shows that companies who are best in class as demand forecasting average 15% less inventory, 17% stronger perfect order performance and 35% shorter cash-to-cash cycle times.

As a vendor, a first step in becoming demand driven is to gather and analyze retail POS data. Without the proper tools, this can be a time intensive process. But with the right tools, a vendor can accept multiple retail POS data feeds from their retail customers and begin to understand item sales and inventory on a store by store basis.

Enabling Category Managers with Power Tools

The Accelerated Analytics® service provides category managers with a robust tool for analyzing sales and inventory at a store level. Not only for the current week, but also for all the weeks of selling in the database. Armed with this data, the category manager can very effectively identify slow moving items and stock-out’s on a proactive basis. In addition, the Accelerated Analytics® service can provide demographic and weather data at a store level so the category manager can understand how these variables impact performance.

What is Category Management?
Category Management is a retail business intelligence and marketing strategy that analyzes consumers and products and the way they interact. Products are collated into like groups called categories. Once defined, these categories become individual business units and are managed as such. Like any other business unit, they go through regular reviews to determine profitability, trends, opportunities, etc. Consumers are analyzed at the point of sale for trends and activities that will assist retailers in tailoring marketing and displays to consumer’s purchasing habits.
 
How does Category Management work?
Category Management works by providing small, specific business units that retailers and their suppliers can analyze individually. The information from each category analysis is compared to the information from other categories as well as the information generated about consumer trends and activities. Retailers and suppliers then collaborate to determine the best way to market and sell their product(s). Some of the key points of analysis are:

  • How do consumers interact with a particular category?
  • What do they purchase? When? Where?
  • What differences are there between consumer interaction with one category as opposed to another?
  • What key factors influence a consumer’s purchase of a particular product in a category?

Analyzing these questions yields detailed information about how marketing can be tailored to different categories, how retailers and manufacturers can influence purchases by product positioning, brand promotion, pricing, etc., and how any of these can be altered to increase sales and revenue based on continued analysis of the consumer. For Category Management to work, however, there must be effective collaboration between retailers and suppliers.What are some of the key benefits of Category Management?
 
Improved Productivity. Because product categories are small, specific business units, category managers are able to define concrete roles and objectives for their categories. This allows them to focus on strategies that specifically benefit their category. Both retailers and suppliers will benefit from this narrow focus and collaborate to accomplish mutually beneficial goals.
 
Reduced Costs. The Category Management model provides a more efficient process than traditional management. Smaller, individual categories are easier to manage.
 
Higher Profit. Category Management relates efficient management and consumer-specific marketing to increase sales. Retailers and suppliers can collaborate to eliminate unnecessary effort and better target their customers. Combined with improved productivity and reduced costs, Category Management offers both retailers and suppliers a marked increase in profit levels.

The efficient consumer response (ECR)

The efficient consumer response (ECR) movement effectively began in the mid-nineties and was characterized by the emergence of new principles of collaborative management along the supply chain. The underlying premise was that by collaborating with trading partners, the supply chain could become more efficient, eliminate excess inventory, and ultimately provide a more efficient response to customer demand. Collaborative forecasting, planning and replenishment (CPFR) and demand driven supply networks (DDSN) are extensions of what was begun with efficient consumer response (ECR).

At the heart of efficient consumer response (ECR) was a business environment characterized by dramatic advances in information technology, growing competition, global business structures and consumer demand focused on better choice, service, convenience, quality, freshness and safety and the increasing movements of goods across international borders aided by the internal European market. Retailers were increasingly realizing their in-store programs can only be effective when inventory is in-stock and on the shelves to sell. Demand planning and accurate forecasting and replenishment are the key – not buying more “safety-stock” because that simply leads to lower operating profits.

This new reality required a fundamental reconsideration of the most effective way of delivering the right products to consumers at the right price. Non-standardized operational practices and the rigid separation of the traditional roles of manufacturer and retailer, threatened to block the supply chain unnecessarily and failed to exploit the synergies that came from powerful new information technologies and planning tools.

In order to better serve customers, and improve operational efficiency, retailers and suppliers began to challenge the traditional supply chain relationships and technologies.

In its simplest form, efficient consumer response (ECR) enables more precise forecasting through sharing and monitoring of POS data.  Improved demand planning within the retail supply chain is the objective. ECR has also lead to innovative new thinking in the areas of market basket analysis, category management and demand planning.

Accelerated Analytics®, developed by the Rainmaker Group, provides an easy no-risk solution to efficient consumer response (ECR).

Accelerated Analytics® connects buyers and suppliers in a collaborative environment where point-of-sale data is used to improve forecast accuracy and decrease stock-outs. The Accelerated Analytics® environment is a hosted service including pre-configured reports, world-class analysis tools and color coded exception dashboards. These tools quickly turn data into actionable information and promote supply chain collaboration.

Outsourcing POS Analysis

Why does an outsourced service make sense? Using an outsourced service for POS data analysis is a great idea, because loading data every week and managing servers is not your core business- it’s an expense.  And worse yet, the data and technology change all the time, which makes them very expensive to manage in-house.

Accelerated Analytics® eliminates all the cost and hassle of POS data analysis.

The Accelerated Analytics® service includes:

  • Automatic loading of POS data for each retailer
  • Hosting of a custom database for all your data
  • Detailed sales, inventory, and forecast reports
  • Training for your users
  • World-class analysis tools
  • Phone, email, and web support on-demand

Better yet, here’s what one of our customers said…

“Accelerated Analytics® allows us to quickly come up with exceptions reports showing when on-hand levels are below desired levels and even red flag zero quantities. With this information we are able to offer support to our retail customers stores that need it most and increase the service level for our customers overall. Having management type reports with charts showing information like our (upward) trend analysis on sales is invaluable.” Steven Pugh VP Operations Howard Products.