Author: Chad Symens

Von Maur EDI 852 Reporting

If you are a vendor supplying to Von Maur, you are eligible to receive product sales activity and inventory data via EDI 852. Preparing to setup and receive the EDI 852 files can be confusing, and creating usable reports for your team can be very time consuming. Fortunately, Accelerated Analytics® provides a simple, outsourced service for all your Von Maur EDI 852 reporting needs.

Using Accelerated Analytics® makes all your reporting headaches go away. With Accelerated Analytics®, we handle all the data conversion, database hosting, and reporting. We even provide training and the end user reporting tools.

Accelerated Analytics® benefits:

  • We do the EDI 852 translation
  • Eliminate manual data entry and manipulation
  • Consolidate all Von Maur store data on all your SKU’s into one reporting database
  • Pre-built exception reports with color coded dashboards
  • No software or hardware to purchase
  • Sophisticated charts and graphs

Available reports:

  • This weeks sales and inventory by store and SKU
  • Last weeks sales and inventory by store and SKU
  • This months sales and inventory by store and SKU
  • 6 week rolling sales and inventory by store and SKU
  • Stove level stock-out exposure
  • Stove level overstock
  • Fast/slow selling items
  • Sell-thru
  • Inventory turns
  • Days supply on hand 

Ulta EDI 852 Reporting

If you are a vendor supplying to Ulta, you are eligible to receive product sales activity and inventory data via EDI 852. Preparing to setup and receive the EDI 852 files can be confusing, and creating usable reports for your team can be very time consuming. Fortunately, Accelerated Analytics® provides a simple, outsourced service for all your Ulta EDI 852 reporting needs.

Using Accelerated Analytics® makes all your reporting headaches go away. With Accelerated Analytics®, we handle all the data conversion, database hosting, and reporting. We even provide training and the end user reporting tools. 

Accelerated Analytics® benefits:

  • Eliminate manual data entry and manipulation
  • Consolidate all Ulta store data on all your SKU’s into one reporting database
  • Pre-built exception reports with color coded dashboards
  • No software or hardware to purchase
  • Sophisticated charts and graphs

Available reports:

  • This weeks sales and inventory by store and SKU
  • Last weeks sales and inventory by store and SKU
  • This months sales and inventory by store and SKU
  • 6 week rolling sales and inventory by store and SKU
  • Sell-thru
  • Inventory turns
  • Days supply on hand

Accelerated Analytics® will give you the ability to anticipate changes in sales and inventory so you can make adjustments before a costly mistake occurs. Our EDI 852 reporting is the best on the market.

Target EDI 852 Reporting

If you are a vendor supplying to Target, you are eligible to receive product sales activity and inventory data via EDI 852. Preparing to setup and receive the EDI 852 files can be confusing, and creating usable reports for your team can be very time consuming. Fortunately, Accelerated Analytics® provides a simple, outsourced service for all your Target EDI 852 reporting needs.

Using Accelerated Analytics® makes all your reporting headaches go away. With Accelerated Analytics®, we handle all the data conversion, database hosting, and reporting. We even provide training and the end user reporting tools. 

Accelerated Analytics® benefits:

  • Eliminate manual data entry and manipulation
  • Consolidate all Target store data on all your SKU’s into one reporting database
  • Pre-built exception reports with color coded dashboards
  • No software or hardware to purchase
  • Sophisticated charts and graphs

Available reports:

  • This weeks sales and inventory by store and SKU
  • Last weeks sales and inventory by store and SKU
  • This months sales and inventory by store and SKU
  • 6 week rolling sales and inventory by store and SKU
  • Sell-thru
  • Inventory turns
  • Days supply on hand 

Retail sales hop 1.2%, pushing hope for the holidays plus 5 simple strategies to raise your sales

The Commerce Department reported that October ’10 sales for the retail industry jumped 1.2 percent from the previous month, the most important gain since March. The rise was driven by a 5 percent spike in auto sales, which analysts said was particularly encouraging because it showed consumers were ready to tackle big-ticket purchases. Moreover, September’s sales gain was revised upward coming from a 0.6 percent increase to 0.7 percent.

Still, consumers remained choosy about where they spent their dollars. Home furnishings stores and electronics retailers each suffered a 0.7 percent drop in sales. Department shop sales also declined 0.7 percent, while health-care stores dipped 0.1 percent.

Instead, consumers returned to restaurants and bars, sending sales up 0. 3 percent. On-line retailers, that have held up much better than their bricks-and-mortar counterparts, registered a 0.8 percent jump. Shoppers also bought more clothing, a 0.7 percent boost.

Excluding autos, retail sales rose a decent 0.4 percent, in spite of the mixed performance across sectors. Retailers are hoping that this momentum will fuel the all-important holiday season.

As outlined by a survey by the National Retail Federation, an industry trade group, nearly 11 percent of consumers have finished the vast majority of the holiday shopping, up from just a bit more than 9 percent a year ago. The group predicted shopper’s average spending would inch around $688.87 in 2010, a 1 percent increase over a year ago.

The NRF’s annual holiday survey found that more shoppers are expected to get gifts for family and friends – and also themselves. The quantity of consumers who said they planned to indulge themselves rose eight percentage points to 57 percent in 2010.

The forecasts, coupled with the brand new October data, paint an image of consumers treading carefully on their way back to the mall. Economists say that spending is unlikely to rebound, with no corresponding improvement in the employment market.

The unemployment rate remains stuck at nearly 10 %, data released from the Bureau of Labor Statistics showed hope. Mass layoffs have declined in size and frequency. And private-sector employment rose 0.3 percent during the third quarter, in comparison with last year, the 1st increase since 2008.

How may you increase add-on sales throughout the Holidays?

Below are a few solutions to boost the units per transaction, and increase the average transaction as a result.

If you want this, you should buy that – Creating feature areas within your store that have a number of major stuff you need to push for holiday, surrounded by complimentary products, helps sell more than just that one item. Use signage and have the workers talk with customers to assist them to know how these products interact.

Stuff the Stockings – I still push stocking stuffers for holiday as customers will almost always be looking for those unique, fun little goods that round out their holiday gift giving, without breaking the bank. Create an entirely stocking stuffer display and make it interactive, just like a stocking stuffer smorgasbord, to inspire customers to get one or more additional items.

Sample products – Whenever they check it out, they are going to buy it. Make sure you have products available for testing everywhere, and use signage, or have your employees interact, to get customers to attempt different products. The chance for a sale rises significantly when you can place the product inside the customer’s hand.

A warm drink is the way to get them to stay – offering a warm beverage like coffee or apple cider gets customers to linger longer. It provides them time and energy to scope out much more of your store as they walk around, enjoying their beverage. And this means they could find more gifts than they planned on, resulting in increased sales.

Wrap the Cash Wrap – You’ve created a number of different ways inside your store to get your visitors to buy more, and the cash wrap may be the final opportunity. Make sure you have impulse items at the cash wrap, that customers can grab and go. Products under $20 usually perform best. Bonuses for items that may be sampled as well as 8-10 of these available for purchase.

So you? Exactly what are your favourite sales techniques to increase Holiday sales?

Posted by Cornelia Ortega.

visit Cornelia’s blog.

Macy’s EDI 852 Reporting

If you are a vendor supplying to Macy’s, you are eligible to receive product sales activity and inventory data via EDI 852. Preparing to setup and receive the EDI 852 files can be confusing, and creating usable reports for your team can be very time consuming. Fortunately, Accelerated Analytics® provides a simple, outsourced service for all your Macy’s EDI 852 reporting needs.

Using Accelerated Analytics® makes all your reporting headaches go away. With Accelerated Analytics®, we handle all the data conversion, database hosting, and reporting. We even provide training and the end user reporting tools. 

Accelerated Analytics® benefits:

  • We do the EDI 852 translation
  • Eliminate manual data entry and manipulation
  • Consolidate all Macy’s store data on all your SKU’s into one reporting database
  • Pre-built exception reports with color coded dashboards
  • No software or hardware to purchase
  • Sophisticated charts and graphs

Available reports:

  • This weeks sales and inventory by store and SKU
  • Last weeks sales and inventory by store and SKU
  • This months sales and inventory by store and SKU
  • 6 week rolling sales and inventory by store and SKU
  • Stove level stock-out exposure
  • Stove level overstock
  • Fast/slow selling items
  • Sell-thru
  • Inventory turns
  • Days supply on hand 

Walgreens EDI 852 Reporting

If you are a vendor supplying to Walgreens, you are eligible to receive product sales activity and inventory data via EDI 852. Preparing to setup and receive the EDI 852 files can be confusing, and creating usable reports for your team can be very time consuming. Fortunately, Accelerated Analytics® provides a simple, outsourced service for all your Walgreens EDI 852 reporting needs.

Using Accelerated Analytics® makes all your reporting headaches go away. With Accelerated Analytics®, we handle all the data conversion, database hosting and reporting. We even provide training and the end user reporting tools. 

Accelerated Analytics® benefits:

  • Eliminate manual data entry and manipulation
  • Consolidate all Walgreens store data on all your SKU’s into one reporting database
  • Pre-built exception reports with color coded dashboards
  • No software or hardware to purchase
  • Sophisticated charts and graphs

Available reports:

  • This weeks sales and inventory by store and SKU
  • Last weeks sales and inventory by store and SKU
  • This months sales and inventory by store and SKU
  • 6 week rolling sales and inventory by store and SKU
  • Sell-thru
  • Inventory turns
  • Days supply on hand 

Accelerated Analytics® will give you the ability to anticipate changes in sales and inventory, so you can make adjustments before a costly mistake occurs. Our EDI 852 reporting is the best on the market. 

Improving Buyer Relationships Using POS Data

Time and time again, when setting up new vendors with Accelerated Analytics®, the same dilemma is expressed in some form or other: “We know that this product sells well here, but our buyer won’t listen to us.”  To determine why, the return question is invariably, “What evidence are you giving the buyer to back up your assertions?”
 
Almost as often as the initial question is expressed, the rejoining comment is met with frustration at the inability to provide the evidence the buyer wants to see.  This can be due to a vast array of issues, not the least of which is simply a lack of time to collect and analyze the available POS data and provide the buyer with real concrete evidence.  Conversely, it is rarely the case that vendors have insufficient data to make these conclusions.  As such, it is frequently a third party data analysis company that can provide the additional tools necessary to turn the POS data into actionable information for the buyer. Here are some tips:

  1. Buyers fall into roughly two categories—those that are helpful and those that aren’t.  If you have a helpful buyer, you’re already a step ahead.  Work with the buyer to determine key performance indicators (KPIs) like target weeks of supply and preferred sales velocity for given items.  (Since these KPIs need to be managed at an item by store level, it may be necessary to use a third party analyst partner to assist you in building your database and reporting solutions.)  Then, track these KPIs for your products and show your results to your buyer—often you have better insight into your product activity in their stores than they do.  Since your buyer is friendly, work with him or her, using the information you’ve tracked and presented, to improve sales, limit out of stock, and prevent overstock.
  2. The unhelpful buyer is more difficult, but by no means a lost cause.  For example, Wal-Mart buyers will almost always refuse to accept a push order of products from you, the vendor. But our experience with Wal-Mart is that this is usually because they have better insight into your product activity than you do.  However, if you can consistently demonstrate that your use of the POS data readily available to you would have rendered a more accurate result or better yield, then the buyer will gradually begin to trust your numbers instead of theirs.  This can be done, for example, by tracking your inventory, computing your weeks of supply, and showing your buyer, by item by store by week, which items you would have shipped to them and when.  If you can cross reference this at the same grain with a report showing out of stock stores, you can easily compute lost sales.   When, over time, the buyer sees the evidence presented consistently and the potential for increased sales, by simply doing nothing on his or her part except accepting an order file from you, you can begin to change your relationship with your buyer, and as he or she becomes more amicable, you can develop the type of relationship that allows you to discuss other KPIs as indicated in tip #1.

Managing POS data at an item by store level can be difficult and time consuming, especially when trying to build detailed, insightful reports like discussed in #2.  Accelerated Analytics® can give you one-click access to reports that will answer dozens of these kinds of questions and more.  

Belk EDI 852 Reporting

If you are a vendor supplying to Belk, you are eligible to receive product sales activity and inventory data via EDI 852. Preparing to setup and receive the EDI 852 files can be confusing, and creating usable reports for your team can be very time consuming. Fortunately, Accelerated Analytics® provides a simple, outsourced service for all your Belk EDI 852 reporting needs.

Using Accelerated Analytics® makes all your reporting headaches go away. With Accelerated Analytics®, we handle all the data conversion, database hosting and reporting. We even provide training and the end user reporting tools.

Accelerated Analytics® benefits:

  • We do the EDI 852 translation
  • Eliminate manual data entry and manipulation
  • Consolidate all Belk store data on all your SKU’s into one reporting database
  • Pre-built exception reports with color coded dashboards
  • No software or hardware to purchase
  • Sophisticated charts and graphs

Available reports:

  • This weeks sales and inventory by store and SKU
  • Last weeks sales and inventory by store and SKU
  • This months sales and inventory by store and SKU
  • 6 week rolling sales and inventory by store and SKU
  • Stove level stock-out exposure
  • Stove level overstock
  • Fast/slow selling items
  • Sell-thru
  • Inventory turns
  • Days supply on hand 

Accelerated Analytics® will give you the ability to anticipate changes in sales and inventory, so you can make adjustments before a costly mistake occurs. Our EDI 852 reporting is the best on the market. 

The BullWhip Effect

The bullwhip effect is a serious problem for vendors. The article below will provide a comprehensive introduction to the problem and impact. After you finish reading the article do this exercise: calculate the total number of stores stocking your products [# of retailers * average total stores], then multiply by 2%, which is an average out of stock rate. This is the total stores that are currently out of stock on your products. Next multiply by an average weekly unit sales for your key product(s). This is your total lost sales opportunity.

Leading retailers and manufactures are dramatically improving sales and profits by embracing a new supply chain model built upon sharing point-of-sale demand data and closely collaborating on forecasts. Research conclusively demonstrates demand driven collaborative supply chain models drive more accurate forecasts, fewer out-of-stocks, higher sales, and higher operating margins.

There are many variations of demand driven collaborative models in service, the most popular of which are:

  • Efficient consumer response (ECR)
  • Collaborative planning, forecasting, and replenishment (CPRF® )
  • Vendor managed inventory (VMI)
  • Demand driven supply network (DDSN)

The overlap of these models and generally slow adoption is creating a great deal of confusion in the market. While each model is slightly different in its approach, definitions, and processes, they all have a common goal: share actual demand data with all parties in the supply chain and facilitate real-time collaboration to reduce inefficiency and improve sales.

The purpose of this article is to discuss the financial benefits of implementing a demand driven collaborative supply chain model and provide best practices for getting started.

AVOIDING THE OUCH OF THE BULLWHIP EFFECT

The basic premise of the demand driven collaborative supply chain model is that in order to achieve the highest possible in-stock and simultaneously minimize waste, all parties within the supply chain must have timely access to actual sales demand data and all parties must have a means by which they can work together to coordinate promotions and business planning.

A forecast by definition is an estimate made in advance of an event occurring and is therefore an educated guess. Unfortunately, even sophisticated forecasting software can have an error rate of 50% on promoted items. Most troubling of all, forecast accuracy decreases, moving backward into the supply chain.

The reason forecast accuracy decreases, moving backward in the supply chain,  can be illustrated by plotting sales over time for supply chain participants as depicted in CHART 1. Notice the actual sales demand recorded at the retail point-of-sale has moderate variation. This is because the retailer builds their forecast model using actual demand as tracked through their point-of-sale systems. But notice how much more chaotic and unpredictable the demand curve becomes as you move away from the actual point-of-sale. Demand as viewed by the supplier, wholesaler, and manufacturer is based on estimated sales, which combined with latency and manually adjusted “safety stock”, causes increasingly inaccurate and chaotic forecasts. Research indicates a fluctuation in actual customer demand of +/-5% will be interpreted by supply chain participants as a change in demand of up to +/-40%. As depicted in Chart 1, although actual demand has only changed +/-5%, the reaction of supply chain participants is dramatically exaggerated and is known as the bullwhip effect. Much like cracking a whip, the user only needs a small motion in their wrist (point of sale) to cause a huge motion in the end of the whip (manufacturer).
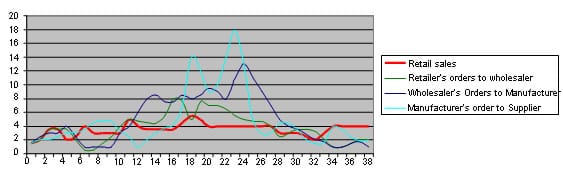
The bullwhip effect causes inaccurate forecasts, inefficiency, and waste within the supply chain. Anytime the forecast line of a supply chain participant (e.g. chart 1; wholesaler, manufacturer, or supplier) is above or below the actual demand line (e.g. chart 1; retail sales) inventory levels are not optimized and out-of-stocks or inventory build-up will occur. The U.S. Department of Commerce estimates $3 trillion in excess inventory is locked in the U.S. and European supply chains. The bullwhip effect is exacerbated by the parties within the supply chain who do not have an accurate understanding of actual demand. In other words, they are forecasting, but the inputs upon which their forecast model is built are inaccurate.

Accurate forecasting and close coordination between supply chain partners can help to eliminate the bullwhip effect and dramatically increase overall profitability. The most effective way to improve forecasting accuracy at each step in the supply chain is to base the forecast on actual sales demand data. In this way, each point in the supply chain can be demand driven and the parties can collaborate on the same forecast inputs. In addition, promotions can be coordinated and managed to maximize sell-thru without causing supply disruptions. As information quality improves, cycle times are compressed through the entire supply chain process.

FINANCIAL IMPACT OF DEMAND DRIVEN COLLABORATION

Numerous studies provide objective financial results from sharing demand data and collaboration including studies from the National Retail Federation, AMR Research, and VICS. The reason the financial benefits are so compelling is they impact both top line revenues and bottom line operating margins; and, these programs are a win-win for both the retailer and the supplier since the financial impact between the two is directly linked.

Financial Impact #1: Increase sales by 5-10%
Average retail industry out-of-stock rates average 8% and can be as much as 40% on promoted items, which results in a loss of sales between 5% and 10%. Demand driven collaborative supply chain programs drive higher sales by improving in-stock rates between 2% and 8%.

Financial Impact #2: Increase operating margins by 5-7%
Many retailers are managing in-stock performance by increasing their base replenishment levels and carrying additional “safety-stock.” While this approach offers a short-term advantage, the long-term drawbacks are obvious; higher operating costs due to slow inventory turnover and higher logistics costs. By sharing demand data, forecast accuracy is improved and less safety stock is required to keep in-stock levels at target. Less capital is tied up in inventory, improving both return on invested capital (ROIC) and gross margin return on investment (GMROI).

Demand driven collaborative programs also have a positive effect on customer brand loyalty. This is because stock-outs also cause another, even more insidious problem – 32% of consumers who can’t find an item will go to another store. If the stock-out occurs three times or more, the consumer is likely to purchase a different brand. So today, the retailer may loose the sale, but tomorrow, so may the supplier. This dynamic creates a powerful incentive to work together for accurate forecasts. As an example, by working with suppliers and closely monitoring point-of-sale data for its 1,450 fastest-selling items, H-E-B Grocery was able to reduce its out-of-stock rate by 22.5% in just eight weeks. Similarly, Sainsbury tracked its 2,000 top items and increased sales by 2%. These are powerful examples of how leading retailers are using demand data and working in concert with suppliers to dramatically improve operating results.

Making Sense of Retail Link Data

Retail Link is an internet based tool created by Wal-Mart, which allows suppliers to access point of sale data and other important information. The benefits of analyzing sales data cannot be overstated – there are case studies documenting sales increase by more than 40% per SKU. Yes! That’s the power of utilizing your POS analytics.

The Challenge Of Retail Link

While Retail Link is an awesome tool, it can be a challenge to work with.

  • Tough To Navigate
  • Tough To Learn
  • Ability To Find The Right Data
  • Ability To Create An Actionable Report

A user must navigate the system, find the correct data, download the data and then create an actionable report. This is a lot of work. Especially if you have a dozen other retail customers who make the same data available. Retail Link users consistently praise the benefits of having access to the raw data, but complain that they do not have the time or tools to turn the data into action.

Thanks to our EDI 852 and POS Reporting, that is changing!

According to an article written by Mike Troy and published in DSN Retailing Today, Retail Link has approximately 100,000 registered users, who work at 40,000 companies and run 350,000 weekly queries. Retail Link contains over 583 terabytes of data over 104 weeks. “Use Retail Link and it will grow your business at Wal-Mart, “says Dan Phillips Wal-Mart’s VP of Merchandizing Systems.

In fact, Retail Link is so sophisticated, about 50 user groups have been formed in the U.S. as an ad-hoc training and support tool. And several third party vendors provide end user training seminars on how to use Retail Link effectively.

Retail Link, Same Great Benefits At A Lower Cost

Fortunately, now there is a tool you can use to fully gain the benefits of Retail Link, while at the same time, dramatically lowering costs.

Accelerated Analytics can automate all of your Retail Link tasks. Accelerated Analytics will provide automated data downloads, pre-formatted reports, exception highlighting and an executive dashboard. Plus, using Accelerated Analytics® your entire team can collaborate in real-time on the same set of reports.

Best of all, Accelerated Analytics will allow you to combine ALL of your retail customer’s data. Imagine a single report or dashboard for JC Penny’s, Wal-Mart, Target, Sears, all on one report. And because Accelerated Analytics is a hosted service, there is no software or hardware to purchase. We can have you up and running in a matter of days for a low monthly fee.

If you’re serious about growing your retail business, let’s jump on a demo call and we’d be glad to show you how we can help you take your business to the next level. You can schedule a demo here or give us a call at (941) 746-2073.