Tag: EDI 852

You Can Have Your Retail Cake and Eat it Too

As retailers strive to create experiences for their customers in their brick and mortar stores, providing an eating outlet is becoming more and more the norm. The concept is not old: Macy’s opened its first restaurant inside a department store back in 1907. Nordstrom has cafes in all of its stores, and have now expanded the concept to “hubs” with a café, nail salons and personal shoppers. Wal-Mart has McDonald’s and Target has Starbucks and food courts. Whole Foods has always had a restaurant inside their stores. Retailers are watching their holiday traffic patterns as they decide what to offer in their stores next. October retail store traffic was down, as was restaurant traffic. The next possible phase for restaurants in retail? Using the food to reflect the branding of the retailer and make “Instagramable”, attractive and unique food items to promote the social media experience. Outdoor malls that are part of master planned residential communities are incorporating living, eating and shopping as an all-in-1 experience, allowing customers to eat, take their beverage out into the mall and shop while hearing live entertainment, making it a social experience.

Sources: fool.com, patch.com
Accelerated Analytics Sponsored the 2017 HIRI Insights Conference in Chicago

HIRI Sponsored by Accelerated Analytics

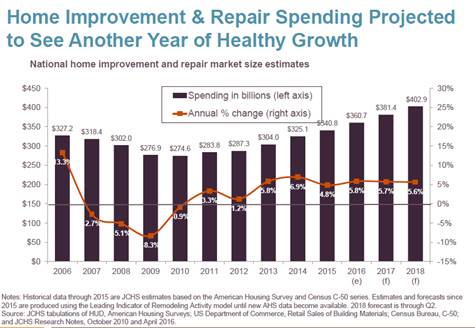
Accelerated Analytics’ CEO, Chad Symens, and Director of Sales and Marketing, Jen Freyer, attended and sponsored the Home Improvement Research Institute event in Chicago this week. HIRI saw a record turnout of attendees at this 2-day event. Home and hardware vendors and retailers joined industry leaders to share insights into the current and future market of retail and the economy in this sector. The speakers brought many common themes to their topics. Home improvement projects are on the rise as millennials start to purchase their first homes and are buying older homes that need renovations. Generation X and Baby Boomers are staying in their current homes longer, adding projects from basement restorations to bath and kitchen remodels. The experts agreed that repair and remodeling spending will continue to go up in the next year. The biggest areas of home improvement projects also include adding technology to make homes “smart”, energy efficiencies, exterior landscaping and outdoor living, and retrofitting older homes. Estimates are that there will be a 57% increase in DIY spending, as many homeowners are trending towards doing multiple and bigger projects all at once. Consumers are indicating they want to invest in their homes and their family circle. Consumer confidence is high and unemployment is low, both great indicators of continuing the upward trend. The Home Depot and Lowe’s both produced very high same-sales in Q2 of this year. Accelerated Analytics’ vendor customers saw even higher gains than that, by tracking stock levels and making informed choices with regard to their product mix in those stores.

Understanding EDI 852 Data

What is EDI 852 Data?

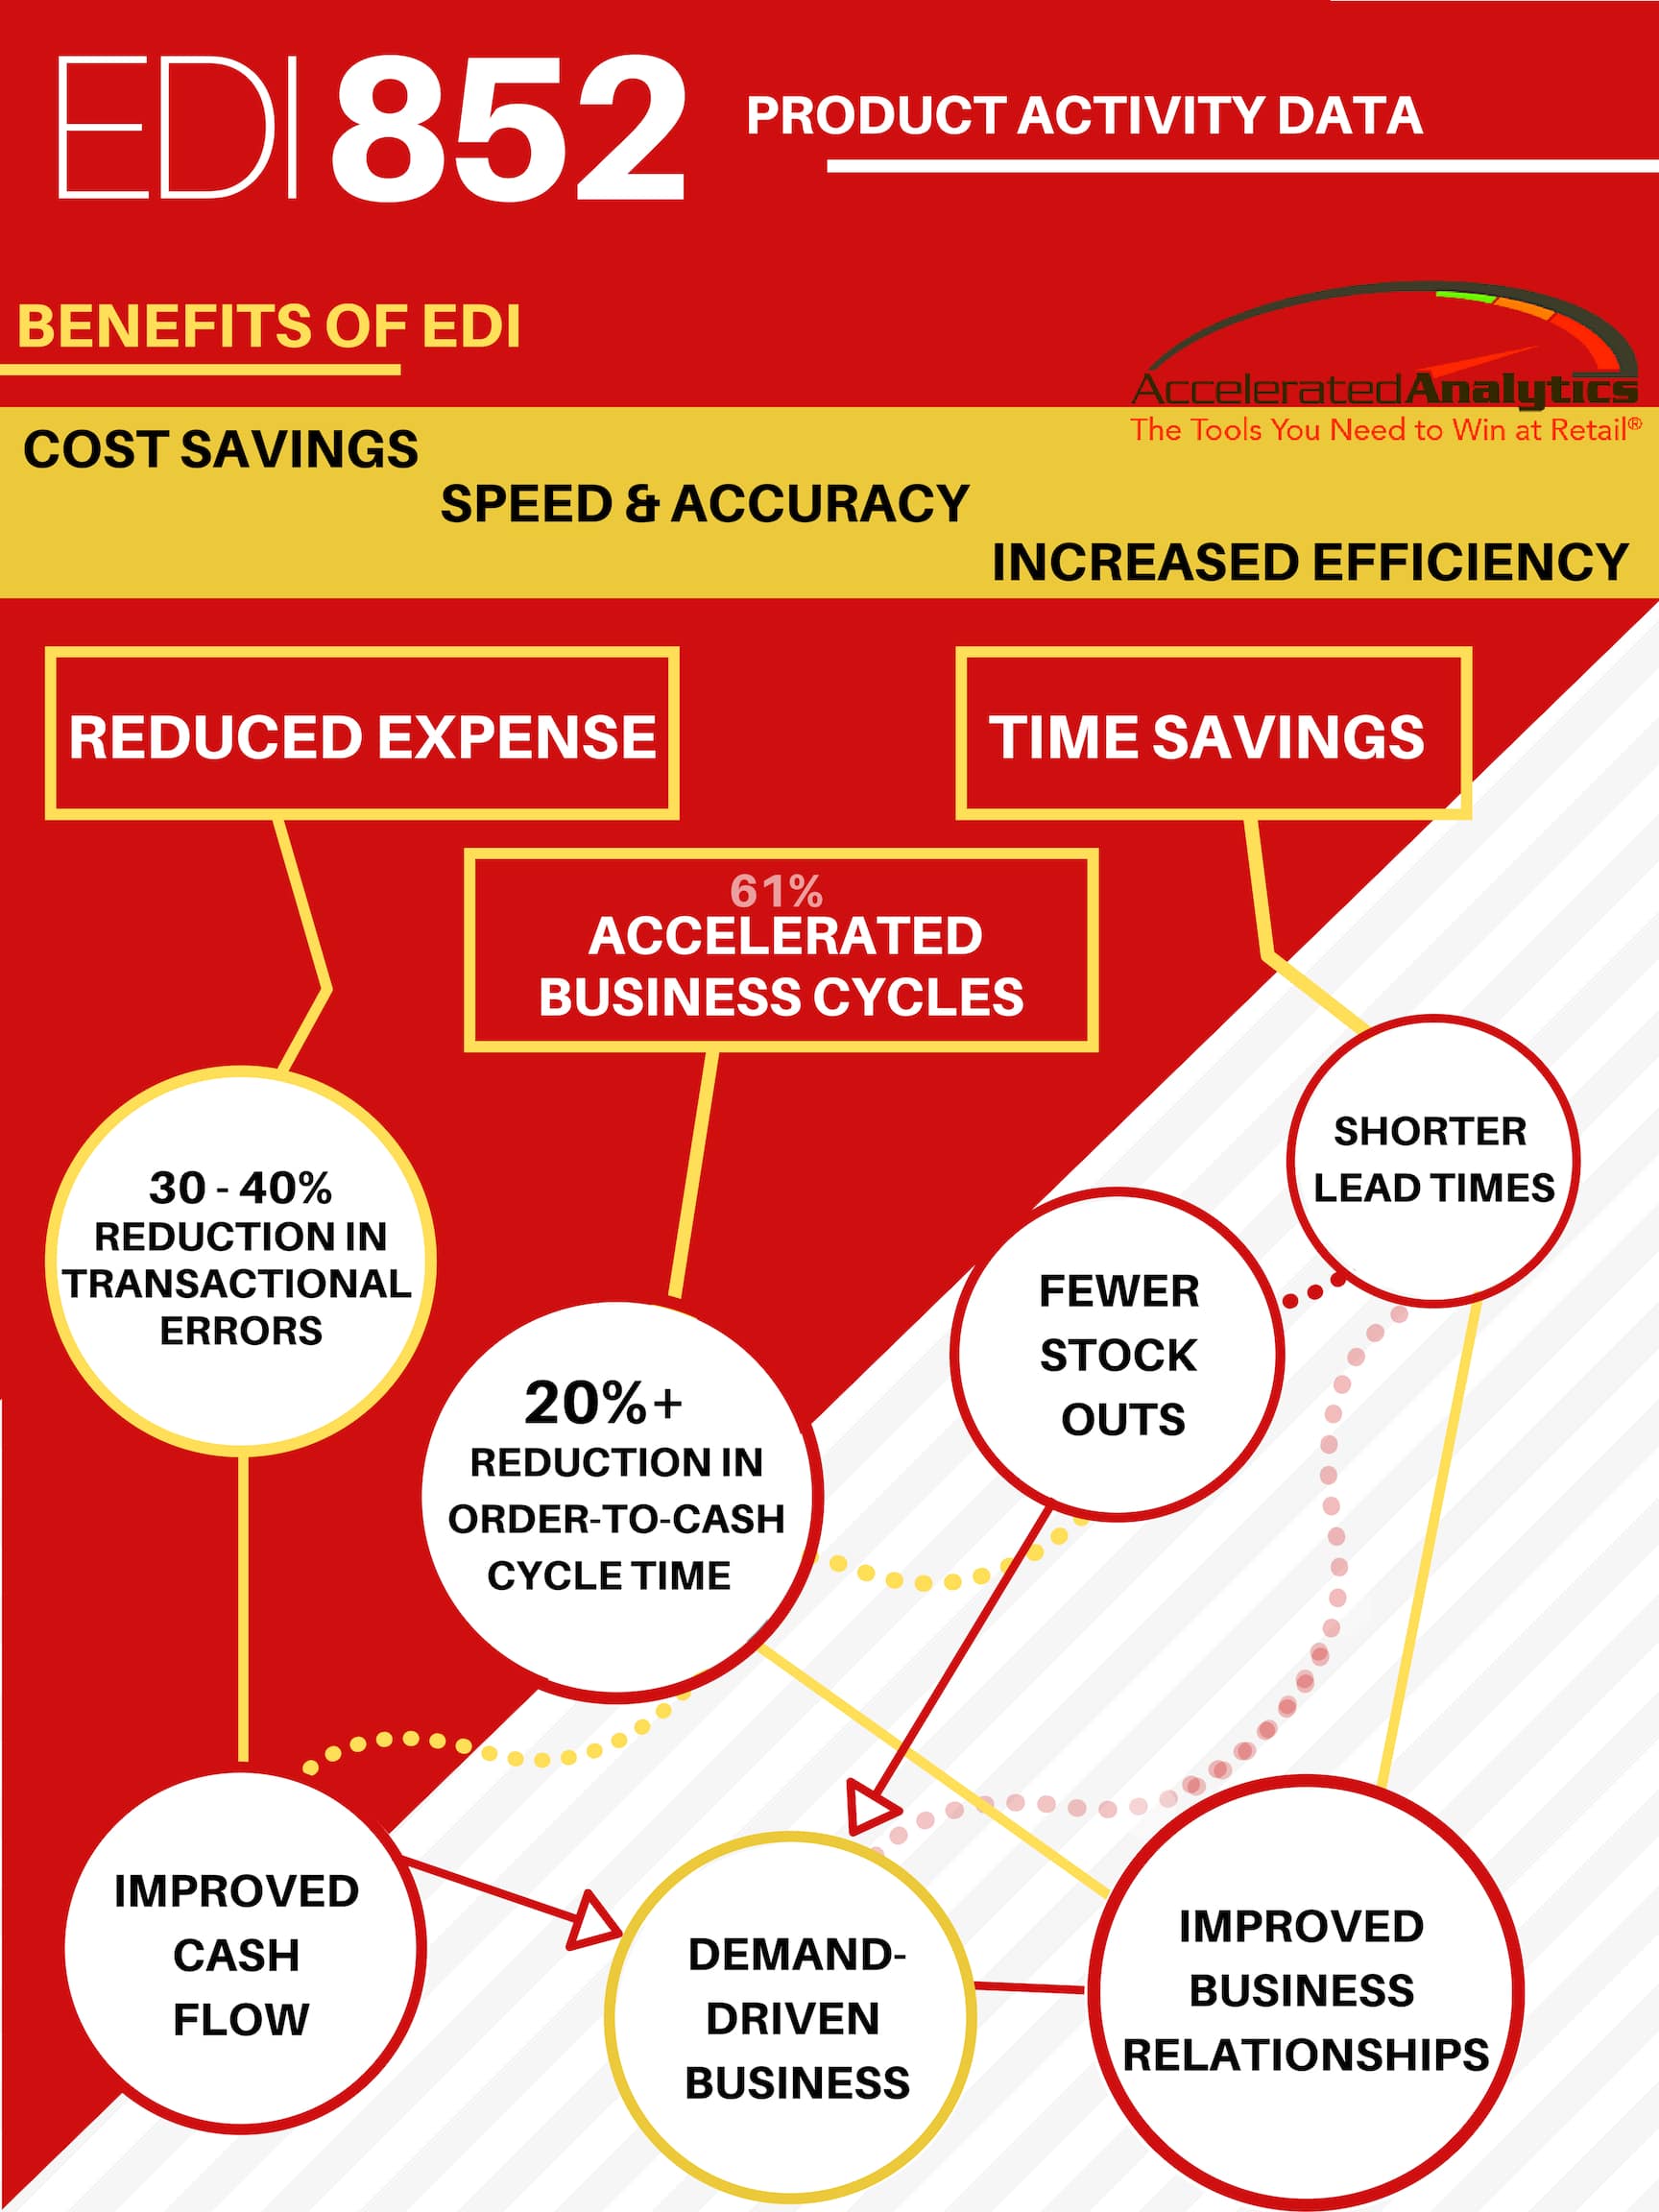
There’s a number of benefits retailers can gain thanks to their EDI 852 data. Just in case you don’t know what EDI 852 is, let us explain it like this. EDI 852 files are usually referred to as “product activity data” or “product activity report.”

A product activity report (EDI 852) is a document that highlights on 2 core factors:

  • It provides data on current products and inventory
  • It shows how products are selling – Point of Sale or POS data

Now, while there’s a lot of data and insights you can get out of your EDI 852, the core data points are going to be;

  • Item and Quantity sold in dollars
  • Item and Quantity sold in units
  • Quantity on hand (inventory)

EDI 852 data files are typically provided on a weekly basis.  The challenge is that each retailer uses a slightly different format, data descriptions, and code identifiers. This is why it’s difficult to estimate exactly what you’d need without having a conversation with you first.

None the less, EDI 852 files routinely contain the following information:

For each item

  • Item description
  • Item UPC

Data can be summarized by:

  • Store
  • Distribution center

Key product activity measures:

  • Quantity sold ($)
  • Quantity sold (units)
  • Quantity on hand ($)
  • Quantity on hand (units)
  • Quantity on order ($)
  • Quantity on order (units)
  • Quantity received ($)
  • Quantity received (units)

Key forecasting measures:

  • Quantity ($)
  • Quantity (units)

Key retail metrics which can be calculated to evaluate performance against your goals:

Working efficiently with EDI 852 data requires a good analysis tool like Accelerated Analytics®. Otherwise, the merchandise planner is left to sort through line after line of data to find problems and opportunities. By using Accelerated Analytics®, the routine tasks of formatting and consolidating data are eliminated, and exception logic can be used to save time.

The Accelerated Analytics® team understands how to work with EDI 852 data. We eliminate all the headaches and give you the preformatted reports you need to run your business.