Author: Chad Symens

Lowe’s Integrating Planning and Execution (IPE)

Back in 2011, Lowe’s announced Q2 financial results with anemic growth and flat same store sales.   To improve performance, CEO Robert Niblock and EVP merchandising Bob Gfeller are implementing Integrating Planning and Execution (IPE), which places an emphasis on putting the right product in the right store at the right quantity.

This new focus got our attention since we provide EDI 852 data analysis and reporting to Lowe’s vendors.  Putting the right product in the right store at the right quantity is exactly what vendors use EDI 852 to accomplish.  Localized merchandising is the right strategy for Lowe’s, but they may run into some challenges executing the strategy with vendor’s assistance.

Many vendors we work with have Lowe’s as a customer, as well as other ‘big box’ retailers.  Across the board, these vendors get EDI 852 from their big box retail customers and we help them analyze the data at a SKU/store level.  But many of these vendors choose not to use Lowe’s EDI 852.

Instead,  they opt to pull reports from LowesLink®.  LowesLink® is a fine system for pulling reports.  The problem is the reports offer a snapshot of performance, not an analysis system.  If the vendor does not have a database to store weekly SKU/store data, it is nearly impossible for them to analyze weekly sales effectively and efficiently enough to participate in localized merchandising strategies.  Lowe’s does have Vendor DART which offers analysis tools, but the most powerful tools are reserved for large vendors.

Weekly analysis of EDI 852 at a SKU/store level is the foundation of a successful program like Lowe’s IPE.  Vendors know their products best and there are simply too many products for Lowe’s staff to conduct weekly SKU/store level analysis.  For Lowe’s Integrating Planning and Execution (IPE) to be successful long term, they must get vendors actively using the EDI 852.

LowesLink® is a registered trademark of LF, LLC.

Using Retail data for Forecasting Demand and Merchandising Planning

Many vendors have started to using EDI 852 data or retailer portal data for sales and retail merchandising, but so far, only a few are using EDI 852 data for forecasting of demand.  But the reality is, vendor inventory at stores is often too low to meet demand and the rates of out of stocks have been increasing. It’s not a big surprise that retailers are maintaining less inventory in stores in this retail environment; the cost of excess inventory is simply too high and open to buy dollars are at an all time low. But with proper forecasting of demand, a vendor can help the retailer to better manage inventory and avoid out of stocks. The great benefit of EDI 852 for merchandising planning is that it is store/SKU level data. Since a typical retailer is forecasting demand at a category and market level, the variability in the rate of sales among stores in a market can be large.

A more accurate model for forecasting of demand is to start at the store/SKU level, calculating an average rate of sale for the store/SKU and then based on the inventory on hand at that store, a weeks of supply. When the weeks of supply for a store/SKU has been calculated, the vendor can compare against the lead time to replenish the store and work to put a true demand driven supply chain in place. This model, while more intensive for the vendor to manage, usually creates a far different picture of inventory needs than simply market level min/max replenishment.

Improving Walmart Retail Link Data Analysis

Wal-Mart’s Retail Link* web site is a rich tool, providing vendors with a well of data for analyzing sales and inventory. The problem for many vendors is that Retail Link provides data, but storing the data, calculating metrics and providing users with analytics and reports can be a time consuming chore. Just this week I have spoken to three Wal-Mart vendors, who have dedicated staff to the task of running Retail Link reports and turning them into reports for other users. From our research working with many Wal-Mart vendors, we have calculated data manipulation and reporting averages 18 hours per week for most Wal-Mart vendors. On an annual basis, that is nearly 1,000 hours of administrative time spent just preparing data for analysis and reporting. In addition to the administrative time, there is a data storage issue most vendors encounter. Since the data is UPC/store level data, most vendors do not have the ability to store each weekly data file at the store detail level. As a result, they lose critical detail, as well as the ability to calculate key metrics like inventory weeks of supply on hand, or comp year performance comparisons. If your organization is spending administrative time preparing Retail Link data for analysis, consider for a moment how much more efficient it would be to eliminate that work and instead focus your staff on data analysis. What stores are performing poorly, what stores are performing above average, do you have the correct amount of inventory at each store? These are all questions your analysts should be analyzing, but instead they are spending half of their week preparing data. It’s a simple matter of efficiency and resource assignment.

*Retail Link is a Wal-Mart software application and is not affiliated with Accelerated Analytics.

Home Depot EDI 852

Home Depot vendors gain a critical advantage using Accelerated Analytics for point of sale data analysis. Home Depot vendors have the opportunity to use EDI 852 data to analyze their business and be very proactive in working with their merchants. A standard Home Depot EDI 852 document contains units sold, units on hand and dollars sold for each SKU and store. By storing this data each week and cross referencing the Home Depot store list, a vendor has the opportunity to understand store and SKU level selling trends and inventory consumption. The Home Depot EDI 852 data provides all the necessary ingredients to calculate key metrics like: inventory weeks of supply on hand, average rate of sale by store and SKU, and if you add your cost information you can arrive at GMROI as well. It has been our experience that Home Depot merchants expect a high degree of data analysis from their vendors, and it has also been our experience that they are very supportive of vendors who use the data to make recommendations on how to improve the business. The key to success is selecting a service provider like Accelerated Analytics that can help you store the data each week, calculate key metrics, and make the analysis and reports available to your sales teams in a timely fashion. Accelerated Analytics also provides advanced analysis like GMROI by plan-o-gram, which is critically important in working with your merchant. Armed with this data, we have seen vendors dramatically increase sales and optimize inventory levels.

Calculating Weeks of Supply Inventory

How to Calculate Weeks of Supply

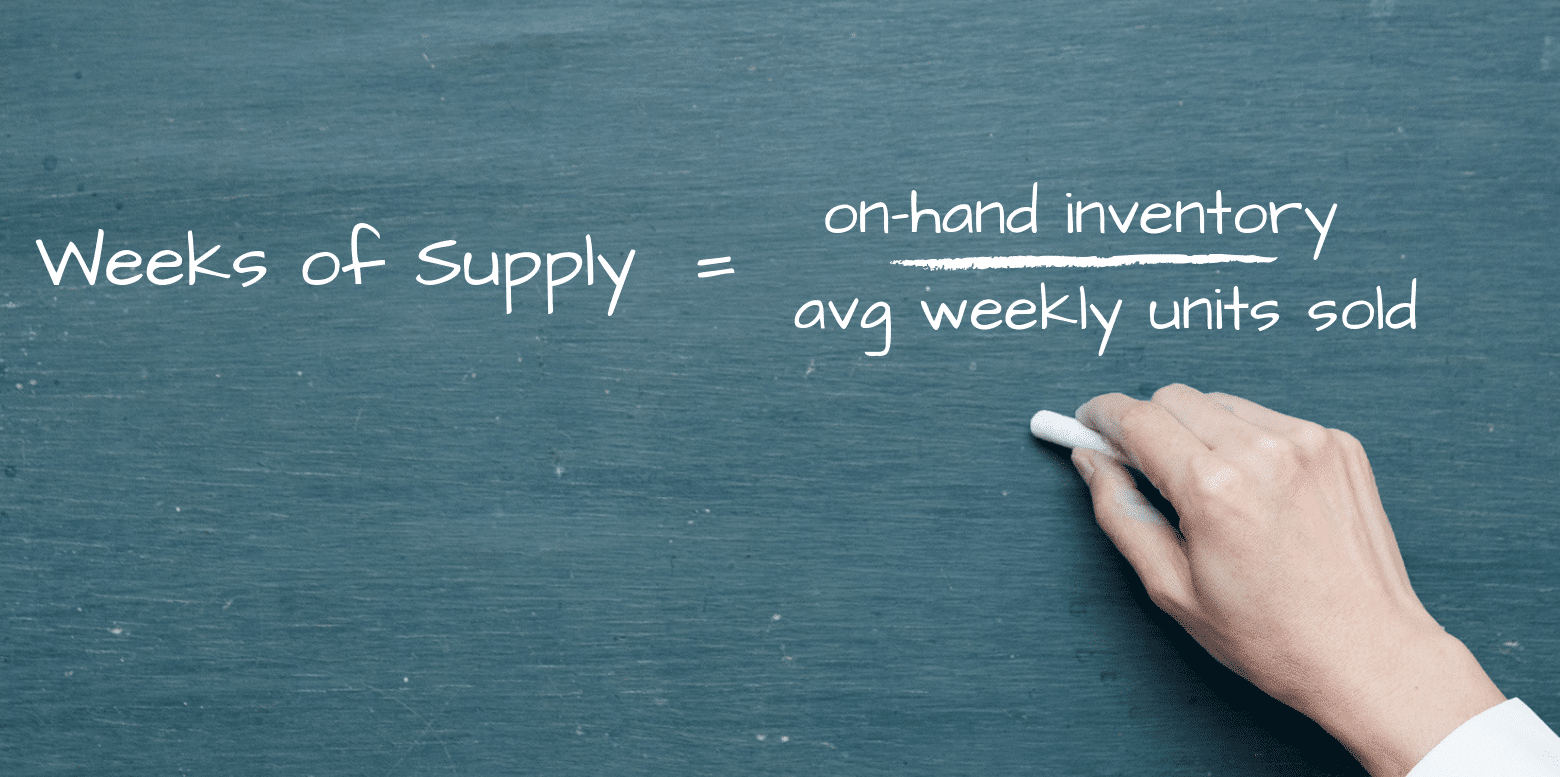
A metric fundamental to managing the retail supply chain is weeks of supply (WOS). Weeks of supply tells the inventory manager how long the current on hand will last based on current sales demand.  By keeping your eye on weeks of supply, you can avoid inventory stock outs and lost sales.  The basic calculation for weeks of supply is pretty simple: on hand inventory / average weekly units sold.  However, our work with vendors demonstrates calculating an accurate and useful weeks of supply can be anything but simple.  Let me explain.  An EDI 852 document will provide units sold and on hand.   Very few EDI 852 documents provide data for inventory on order, inventory in transit, or inventory in the warehouse.  More sophisticated systems, like Wal-Mart’s Retail Link, will provide the additional inventory data.  So, the first issue an analyst working only with EDI 852 must overcome is to gain a complete picture of the inventory in the supply chain – all the inventory.  If you are working with a Home Depot 852 or a Lowe’s 852 you must also gather your purchase order and shipping data so that you have the ability to understand on order and in transit inventory.  You must also decide how to apply inventory in the supply chain.  That is, will you sum on hand + on order + in transit  to use as the numerator in your calculation?  Or perhaps you would prefer to ignore the on order due to long shipping lead times and use on hand + in transit.

Weeks of Supply

The next consideration is how to calculate the average weekly units sold which is the denominator in the weeks of supply calculation.  This requires some careful consideration.   If the number of weeks used to calculate the average is not selected correctly you will arrive at a misleading result.

One vendor has products which are non seasonal and tend to have very steady and consistent sales.  The other vendor has products which are seasonal and sell much higher in the warm spring and summer months.  When choosing the number of weeks for calculating the weeks of supply, you want to consider the rate at which your demand changes.  If your demand is fairly steady,  like the non seasonal vendor, a larger number of weeks can be used.  If, however,  your demand tends to change rapidly due to seasonality or based on some event like selling licensed apparel during football season, then you should choose a smaller number of weeks.  Our experience shows that a seasonal vendor should consider a four week window of sales demand and a non seasonal vendor should choose 8 to 10 weeks.

The final point to make about calculating weeks of supply is to consult with your retail buyer on the period of demand they are using.  If you are using four weeks and they are using six weeks, you will arrive at different order quantities.  By discussing the calculation, you may find your method is more accurate or you may find the retailer has good reasons for their method.  If you still feel your method is more accurate, then calculate weeks of supply using both methods and track the accuracy over time.  This will provide you with the factual data to either change your calculation method to align with the buyer’s, or demonstrate to them why your calculation is more accurate.

Frequently Asked Questions about Accelerated Analytics

What is EDI 852?   EDI 852 is a standard data format used to transmit product activity data. Files are typically sent daily or weekly and will include sales activity by product, and for some retailers, inventory on-hand.  Activity is typically summarized at a distribution center level, unless store level data is deliberately selected. Some EDI 852 forms will also include pricing information, inventory on-hand but unavailable for sale, order point, order quantity, and order status. EDI 852 is provided as a text data file using special character sets to describe the coded data to the decoding software.

My organization is a manufacturer and our retail customers are offering to send us point of sale data.  Can we use Accelerated Analytics® to analyze POS data? 
Absolutely! Accelerated Analytics® was designed to provide business users with a simple and effective means to analyze POS data from both a buyer and manufacturer/supplier perspective. Our engineers can work with your team as well as the retailer to load the data into Accelerated Analytics® and format your custom reports.
Can we use Accelerated Analytics® to analyze EDI 852 data?
Yes.  As a part of our service we accept EDI 852 data and provide the translation into a useable format for reporting and analysis.
What’s the difference between point of sale data and EDI 852?
First, the format of the data is very different.  EDI 852 is provided as a text data file using special character sets to describe the coded data to the decoding software.  If you open an un-translated EDI 852 file, you will have a very hard time understanding what you are looking at.  POS data, on the other hand, is typically provided in a text file with descriptive column headers, which can be easily opened and used in Excel.  Second, EDI 852 contains a basic set of product activity data, while a POS file is usually much more rich.  POS often will include cost and price information, and more detail inventory.
What retailers are you working with today?
A list of our currently covered retailers can be found here.
What industries do your vendor customers work in?
Our customers include apparel, footwear, consumer products, specialty hardlines, health and beauty, pharmaceuticals, and grocery.
Do we have to setup our own reports?
Not unless you want to.  Our service includes many pre-configure template reports that we customize during the on-boarding process to meet our customers precise needs.  Templates are included for sell-thru, stock-out exposure, inventory on-hand, period over period sale and inventory comparisons, top selling items, and much more.  All reports can be viewed by product, product category, store, geography, time, etc.  The reports are saved and available to end users with one click of the mouse.
What is collaborative forecasting, planning and replenishment (CPFR)?
(CPFR) Collaborative Planning, Forecasting, and Replenishment is a business practices that combines the intelligence of multiple trading partners in the demand planning and fulfillment of customer demand. CPFR was pioneered by Wal-Mart as a next step to efficient consumer response (ECR) and vendor managed inventory (VMI) and is now promoted by the Voluntary Interindustry Commerce Standards Association (VICS). CPR is a proven retail supply chain improvement process.
What is the bullwhip effect and why is it important?
The bullwhip effect among supply chain partners is a situation in which the supplier has a clearer view of demand than the retailer, but a less accurate forecast. Traditional supply chains are extremely prone to this bullwhip effect; typical order fluctuations of +/-5% on the customer end can easily balloon to +/-40% on the manufacturer end, thus showing an increasing demand variation of 2:1 at each level of the supply chain. Accurate forecasting can help to eliminate the bullwhip effect and increase overall profitability by 5%. The most effective way of smoothing out bullwhip effect oscillations is for suppliers to understand what drives demand and supply patterns. Understanding demand and supply patterns is best accomplished through a detailed look at POS data.
What makes Accelerated Analytics® unique?
Accelerated Analytics® connects buyers and suppliers in a collaborative environment, where point-of-sale data is used to improve forecast accuracy, demand planning, and decrease stock-outs. The Accelerated Analytics® environment is a hosted service including pre-configured reports, world-class analysis tools, and color coded exception dashboards. These tools quickly turn data into actionable information and promote data based decision making.  With Accelerated Analytics®, there is no software to buy or install and Rainmaker Group does all the data processing.
Who are some companies that have implemented collaborative planning forecasting and replenishment (CPFR)?
Over 150 companies have implemented collaborative planning forecasting and replenishment (CPFR) including: Sara Lee, Wal-Mart, Schering-Plough, Walgreens, Kmart, Target, Eckerd, Safeway, Ace Hardware, Manco, Canadian Tire, Johnson & Johnson, Carrefour, Henkel, Kimberly-Clark, Marks & Spencer, Metro, Proctor & Gamble, Sainsbury’s, Nestle, Best Buy, Scan Disk, and Federated. In all likelihood, there are many more unpublished implementations as well.
How is my retail supply chain improved by demand planning using EDI, DDSN, or CPFR?
Studies of retailers by Harvard Business, Grocery Manufacturers Association, National Retail Federation, and AMR Research show results of 15% less inventory, 17% better perfect order performance, and 35% shorter cash-to-cash cycles. The close collaboration between buyers and suppliers makes these improvements possible. Accelerated Analytics® provides the technology in a hosted service so there is no hardware or software to purchase.
If our suppliers are not asking for POS data, why should I consider Accelerated Analytics®?  
It’s not a surprise your suppliers are not asking for data. Most suppliers are intimidated by the prospect of asking for POS data and they do not have the tools to manage and analyze that volume of data. Successful business transformation does not begin as a reaction, but rather because business leaders have the vision to proactively invest in tools which drive their business forward faster than their competition. Research shows that when retailers proactively engage suppliers to collaborate on demand forecasting, 57% report improved relationships. Demand planning in the retail supply chain and collaboration between buyers and sellers, leads to more accurate forecasts and higher sales.
Why can’t we just use our electronic data interchange (EDI) system to send suppliers demand planning data?  
Many retailers have tried using EDI 852 to take advantage of collaboration and demand planning opportunities with suppliers. This is a natural first step; the infrastructure for EDI 852 is already in place, serving as the communication medium between retailers and suppliers. But most retailers are finding that sending out an EDI 852 document with summarized POS and inventory replenishment does not provide much benefit. Why? EDI does not add any new information; EDI is summarized at such a high level, it provides about the same detail as the purchase orders already in the system. The best a supplier can do with EDI 852 is load it into excel, because they do not have an analysis tool. In addition, parsing out a separate EDI 852 file every week for each supplier is time intensive. Most importantly, the supplier rarely has the tools necessary to accept the data and conduct effective analysis.

Analyzing POS Sales for Home Depot Markets

Over the past month or so, we have been rolling out new sales analysis for our Home Depot vendors on market performance.  Vendors to Home Depot using EDI 852 know buyers often want to receive sales analysis at a market level.  What we often find, however, is the analysis conducted does not take into consideration the number of stores in the Home Depot market.  To conduct a proper POS analysis of Home Depot markets you really have to take into account the number of stores in market.

For example Home Depot market 48 has 80 stores, while markets 138 and 160 have one store.  By summing the units sold from the EDI 852 to a market level and then dividing by the store count in that market, you can get an average sales per store for the market.  This metric is very useful in comparing the performance of the markets in a meaningful way.


In addition, you can use the SKU count in your plan-o-gram to further compare the performance of the stores at a market level.  You might also consider a store level sales analysis so you can rank your stores by sales volume A to E.  This lets you not only compare the store against the average sale in the Home Depot market, but also against its sales volume peers.  POS sales analysis by Home Depot market can yield some very actionable results, give it a try.

Promotional Displays – Do they work?

Many vendors use displays at retail customers to drive higher visibility and increased sales. A floor pallet or wing stack with product is a popular display program. These programs are often offered to the retailer at a discounted price and usually require the vendor to absorb both the discount and the cost of preparing the display. The objective is a short term boost in sales that hopefully creates long term repeat buyers. The question is, do displays work?

We have been studying this exact question for a number of clients who sell at Home Depot, Wal-Mart, and Lowe’s. Unfortunately, the impact of displays can be very difficult to analyze, for the following reasons.

· The SKU’s on a display are usually the exact SKU’s that are available on the shelf and as a result it is not possible to uniquely track a display sale vs a regular on shelf sale. You can look at the sales before the display shipped and after it shipped and calculate the change in sales, but it’s not an exact science.

· Shipping of products is increasingly going through a distribution center and not directly to the store. As a result, the exact store and delivery date of displays can be difficult to track without significant extra effort and coordination with the retailer.

· The retailer often exerts a significant amount of influence on store selection and the timing of when the display will be shipped. While this is understandable, it can be detrimental to the vendor and, unfortunately, sales.  Not all stores warrant a display, and for many products, the timing can have a large impact on sales.

· The execution of the display can be uneven across stores, since many store managers have a great deal of latitude on where the display will be located. In addition, store managers have latitude on the length of time a display will be available, and when the display is broken down and the inventory put into the regular shelf position.

What can be done to increase the measurability and effectiveness of displays?

· The most important action a vendor can take is to use a display SKU that is different from regular on shelf items. This is the ideal solution, but in reality this is very hard to do, because retailers do not like to have new SKU’s and most especially if the item is a short term sale.

· Work with the retailer to design display programs that can be accurately tested. There are several variables you can work to control: store quality, location, timing, display type. The key is to create test programs which have these variables controlled, so you can track their success. For example, you might choose 50 grade A (high sales) stores in two geographically similar markets and ship a display to them in the spring. Then ship the same display to the same stores in the fall. This provides the ability to understand if time of year impacts the rate of sales. You can then create a program that changes a different variable and test its impact. Operationally, this can be challenging because often the retailer must approve the display store list and timing, but working together, there is an opportunity to explain the benefits of testing and the cost realities born by the vendor that make the test essential.

Accelerated Analytics will be posting additional thoughts on displays in the future and welcomes your feedback and insights.

Promo strategies for seasonal products

If you have a seasonal product, is it best to run promotions during the core selling season or during the down season? I’ve been analyzing this exact question for a customer this week and the data can make a case for both approaches. On the one hand, it seems like running a promotion like a rebate or floor display during the key selling season makes sense. In that case, the promotion is timed to when the consumer is likely to purchase your product. Or at least be thinking about it. On the other hand, if the consumer is likely to purchase your product during the key selling season anyhow, perhaps managing inventory and avoiding out of stock is the right strategy. If promotions are aimed at the non-core selling season when demand is historically low, doesn’t that provide the opportunity to increase sales? It’s a difficult question and I’d be interested in hearing Brand Managers experiences and insights.

Heading in the right direction

Retail sales consultant Retail Metrics Inc. predicts that the 30 national retailers it tracks will this week post a 3.4% gain in sales for December at stores open for at least a year. That is atop a 3% gain for December 2009.

Overall, the National Retail Federation trade group forecasts that retail sales in November and December increased by 3.3% this year to $451 billion.

The positive gains made this holiday season appear to be sustainable. In December 2010 and already in the New Year our customers are engaging us to help with detailed custom data analysis for line review preparation. This is always a good sign of an improving economy. It means business leaders are ready to compete. They are looking for opportunities and making sure any weaknesses are explained, along with a plan for improvement. Underlying all of this is very careful point of sale data analysis, so that plans and recommendations are fact based. We have been carefully analyzing products across retailers, identifying trends in product sales, geographic trends, pricing variances, etc.  It’s amazing what EDI 852 can tell you if you have a good database with several years of history. Dig into your EDI 852 and get ahead of your competition.