Author: Chad Symens

How To Use Business Analytics To Fuel Your Company Growth

Data And Business Analytics

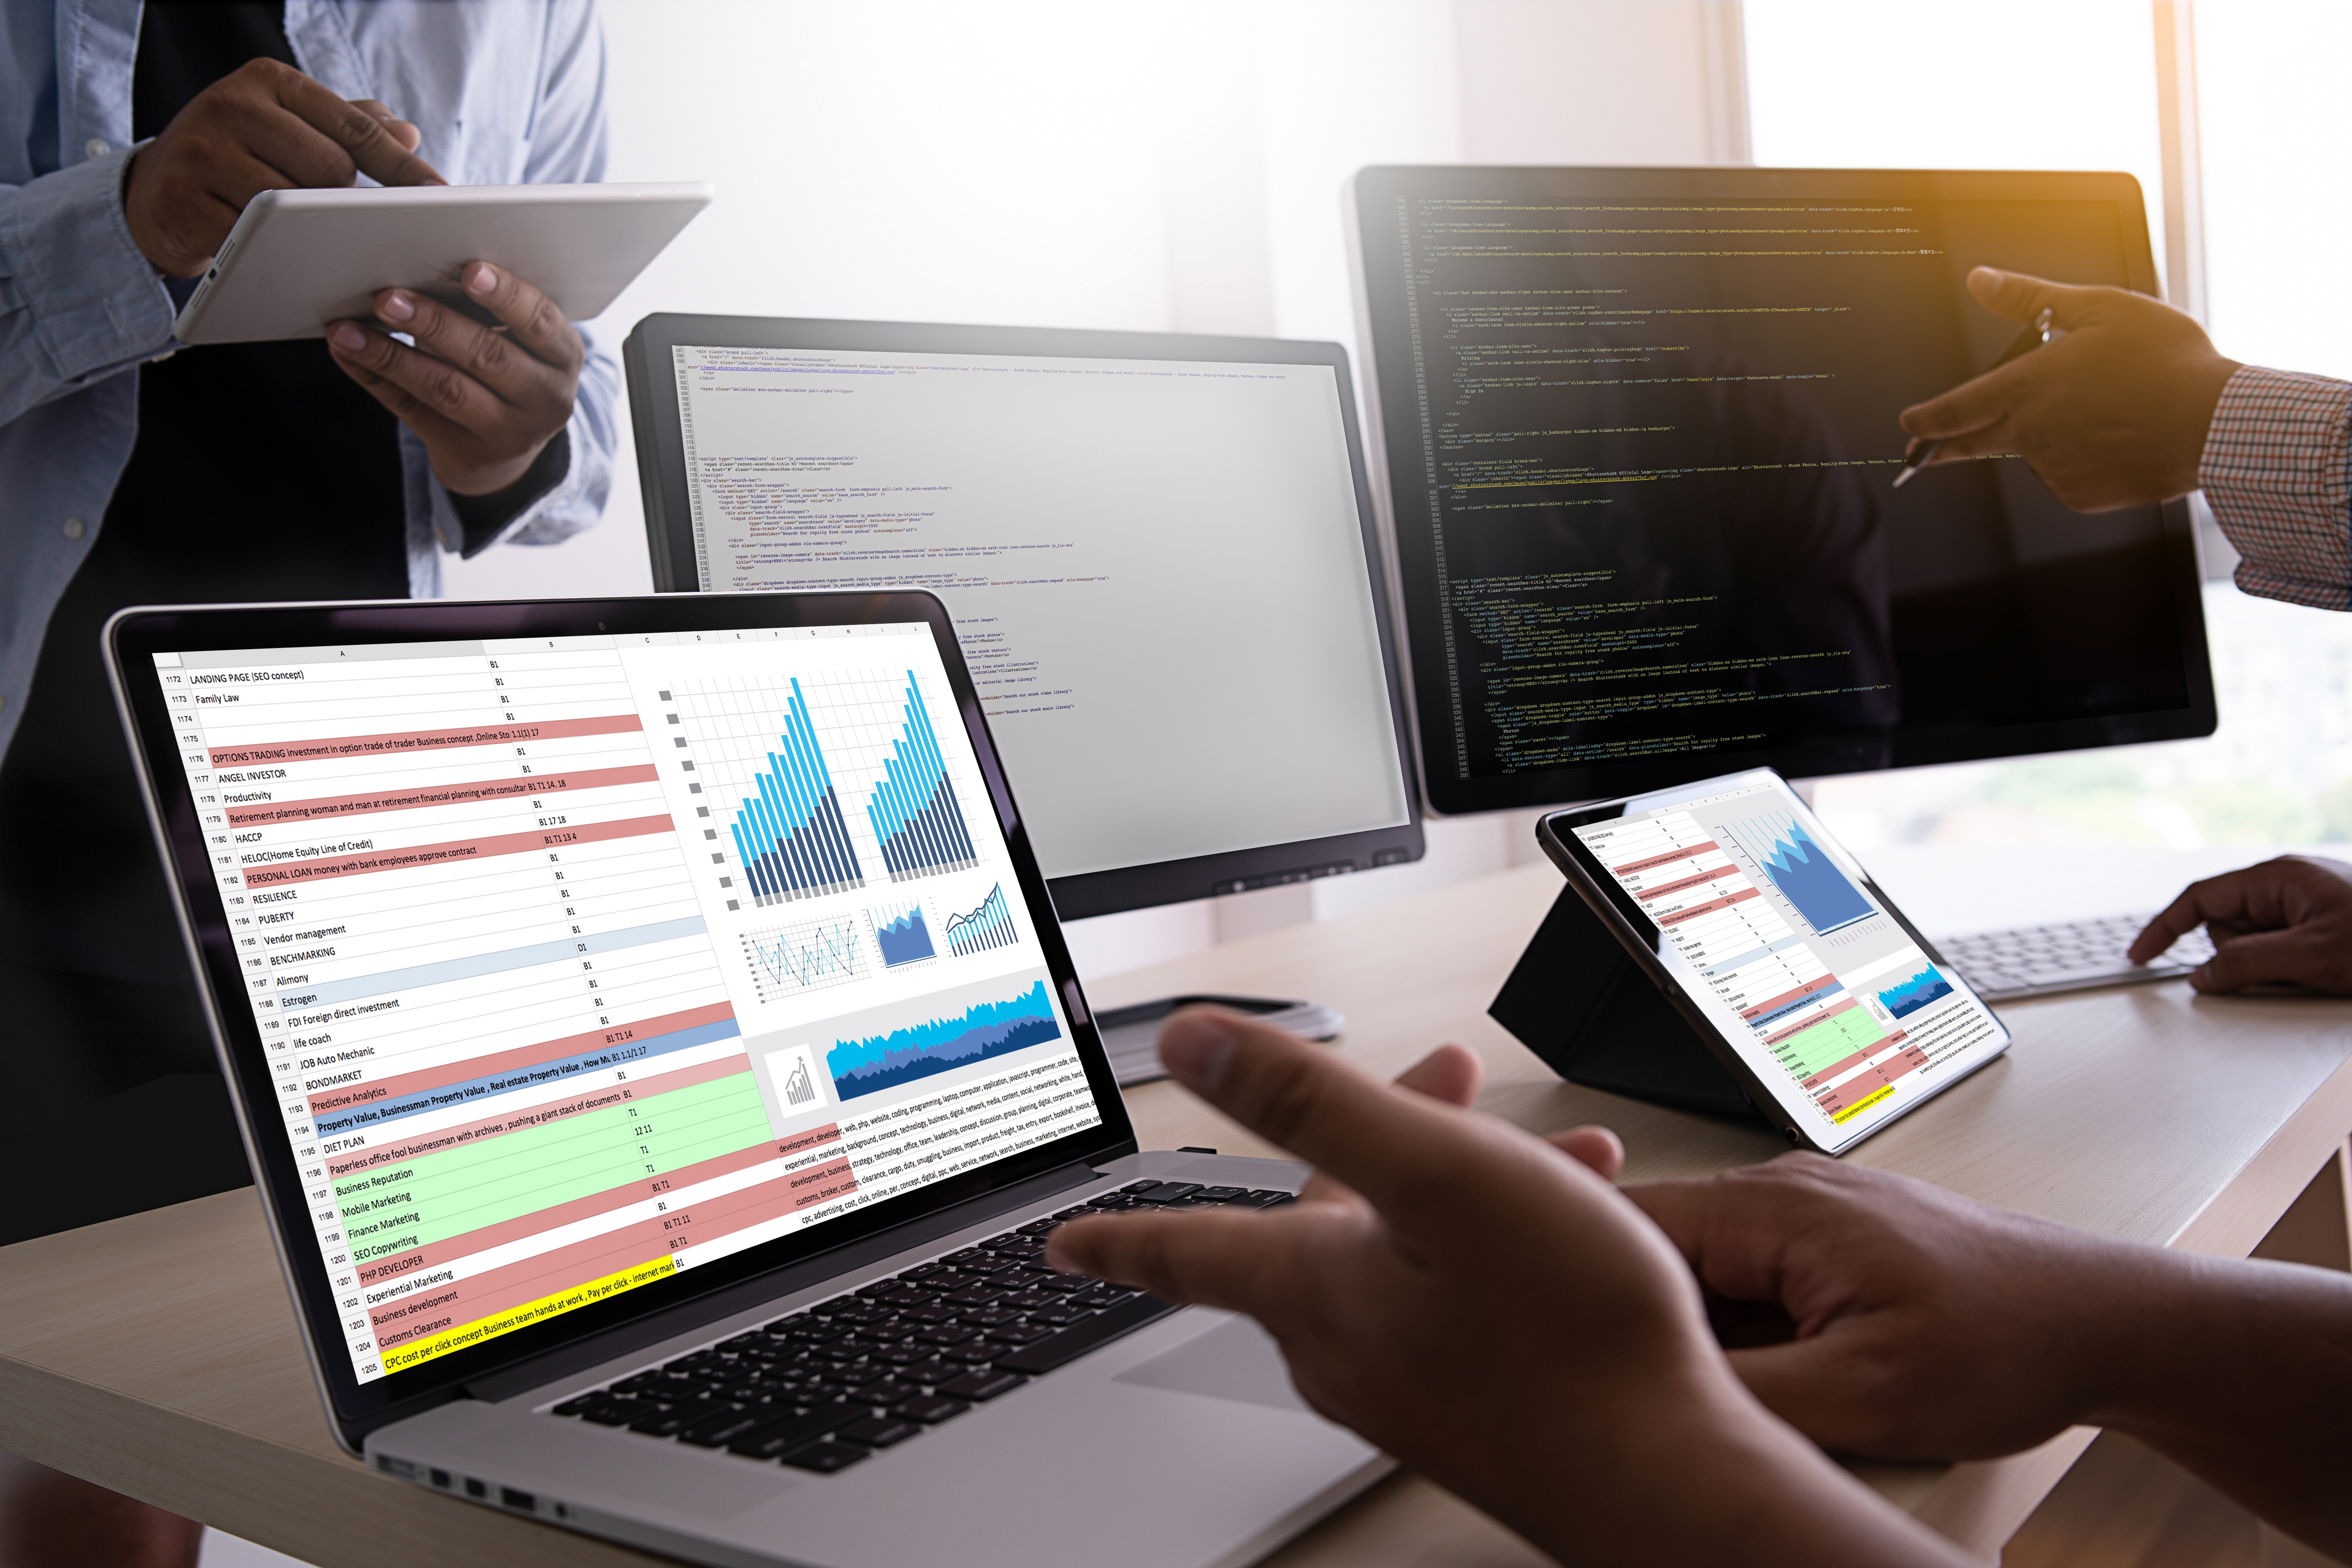
Business Analytics (BA) refers to the practice of exploring a company’s data with a core focus on statistical analysis. Business analytics is used by companies that are committed to data-driven decision-making, which is vital for fueling the growth of your business and gaining a competitive advantage over your market. It requires quantitative methods and evidence-based data for business modeling and decision making, therefore it requires the use for Big Data.

Big data refers to a large amount of data, which can be structured or unstructured. When companies analyze big data, they’re looking to get concrete insights  that will allow them to make better decisions and strategic moves.

We can use BA to gain insights that guide business decisions, allowing you to automate and optimize the processes of your company. Data-driven companies treat their data as a corporate asset (because they are) and leverage it for a competitive advantage. It’s not enough to just collect business data, you need a way to analyze that data so it can be used to optimize your business.

Business analytics can refer to any data field that your company may use to make data-driven decisions, such as POS data.

Successful business analytics has many layers, such as collecting accurate data, having skilled data analysts, the right data tracking software/tools and a full commitment to data-driven decision-making to name a few.

Benefits of Data-Driven Decision Making with Business Analytics

Companies use business analytics (BA) to make data-driven decisions. The insights gained by BA allows these companies to optimize and automate their business processes. Data-driven companies that utilize Business Analytics achieve a competitive advantage because they are able to use these insights to:

  • Conduct Data Mining (Find New Patterns and Relationships)
  • Complete Statistical Analysis and Quantitative Analysis (Explain Why A Result Occurs)
  • Test Current & Previous Decision Making Using A/B Testing and Multivariate Testing
  • Make Use of Predictive Modeling and Predictive Analytics to Forecast Future Results

BA also provides the support needed for companies in the process of making proactive tactical decisions, which makes it possible for those companies to automate decision making in order to support real-time responses.

Examples Of Business Analytics

Most commonly, business analytics focuses on two core areas, one being business intelligence and the other advanced analytics.

Business intelligence focuses on examining historical data to show how a business department or individual performed over a specific time. When we look at the most successful companies, this is often commonplace for them. Without the data, there’s nothing to compare it against, there’s no way we can improve the performance of a specific department or team member.

The second area of business analytics involves deeper statistical analysis, we call this advanced analytics. Advanced analytics may focus on predictive analytics by applying statistical algorithms to historical data to make a prediction about the future performance of a product or service.

This area could also refer to other advanced analytical strategies, such as cluster analysis or grouping customers via multiple data points.

Specific types of business analytics include:

  • Descriptive Analytics – This tracks key performance indicators (KPIs) to understand the current state of a business.
  • Predictive Analytics – This uses trend data collected to assess the likelihood of future outcomes and projections.
  • Prescriptive Analytics –  This uses past performance to generate recommendations about how to handle similar situations in the future.

While business analytics, business intelligence and advanced analytics are often related, there are areas where they differ.

Business Analytics vs. Data Science

While advanced business analytics can sometimes resemble data science, there is clear difference between the two.

For example, advanced statistical algorithms are applied to data sets, but that doesn’t mean data science was needed. There’s a number of business analytics tools that can perform these types of functions automatically, complex data science skills are not needed.

Data science is complex, it involves more than just custom codes and open-ended questions. Data scientists generally don’t set out to solve a specific question, but business analysts do. Data scientist explores data using advanced statistical methods and allow the features in the data to guide their analysis.

Business Analytics Applications

There’s a number of different business analytics tools, such as:

  • Data Visualization Tools
  • Business Intelligence Reporting Software
  • Self-Service Analytics Platforms
  • Statistical Analysis Tools
  • Big Data Platforms

One of the biggest growing areas among business analytics tools is self-service. In the age of the dot com era, software demand is at all-time highs. Users are looking for a powerful software solution that doesn’t need specialized training to operate. This has fueled the demand for easy to use tools and applications.

Business analytics tools can be installed on single computers for small applications or added to server environments to use throughout the company. Once installed, business analysts can use them to create reports, charts and web portals that track specific metrics in data sets.

Now, once specific data goals are determined, the analysis methodology is selected and data is acquired to support that analysis. Most companies have one or more business systems, this data must be extracted from all systems. Once the data is extracted, data cleansing will begin and the data will be placed into  a data warehouse.

From spreadsheets with statistical functions to complex data mining and predictive modeling applications, there’s many different tools used in business analytics. As data patterns and relationships are found, new questions are asked, and the analytical process iterates until a business goal is accomplished.

Deployment of predictive models involves scoring data records, typically in a database, and using the scores to optimize real-time decisions within applications and business processes. BA also supports tactical decision-making in response to unforeseen events. And, in many cases, the decision-making is automated to support real-time responses.

In Closing

As you’ve learned, business analytics plays a big role in making real-time decisions that can impact your company for years to come. The insights BA can give you lead to competitive advantages in the marketplace. It leads to making the right decisions at the right time.

5 Ways to Increase your Sales in 2019

Increase Sales

Photo by Mike Petrucci

Retail can be a volatile space – at times, it’s a feast-or-famine situation. Many times, a sharp decrease in sales are due to factors outside of human control such as bad weather, product recall, new competition, changing consumer preferences, etc., but there are plenty of ways to combat the bottom-line-eating “slump” in sales.

Your business exists to provide goods and services to your customers as well as, of course, growing your ROI. Knowing how competitive the retail sector is, you must be thick-skinned to successfully grow a business in this cutthroat industry.

But you also have to be innovative.

Consider the following actions that, done right, will boost your sales, customer base and ultimately your ROI.

POS Data Analysis

Photo by Stephen Dawson

Analyze your POS data

These reports help you identify changing consumer preferences and new trends
Consumers can be fickle. Here today, gone tomorrow, taking their dollars with them. You have to be able to keep up with these changes and act quickly to shore up any cracks that begin showing. Keeping up with ever-changing landscapes is the only way to continue to serve your customers in a way that makes them happy, thus more willing to give their loyalty (dollars!). Analyzing and reporting POS data lets you see daily fluctuations in buying trends, stock availability, and shopper behaviors and give you the ability to jump into action immediately to adapt to any changes you see.

The problem that often crops up is that gathering, arranging, and reporting your POS and EDI data is often quite cumbersome and time-consuming. Even with a dedicated person doing all of the aggregation and reporting, it might be too late to act when you finally get your data.What’s Monday’s data going to do to help you on Thursday? Luckily, there are cutting-edge technologies that do it all for you. Automatically. Up to the minute. Accelerated Analytics has been helping retail brands boost their bottom line for the past 16 years by automating the process of gathering, analyzing and reporting on the most valuable asset you have – your POS and EDI 852 data.

Optimize your inventory levels

Optimize Inventory

Photo by chuttersnap on Unsplash

The way you manage your inventory can make or break your business. Not carrying enough product can cause stock-outs and lost dollars. Your customers will shift their loyalty to another store that does seem to have the products they need. On the flip side, carrying too much inventory can eat into your ROI, not to mention take up valuable floor space. You also have to consider returns/exchanges/refunds as potential interruptions to the sales flow. Accelerated Analytics’ predictive and prescriptive software can instantly consider POS and other raw data to produce actionable insights that help you manage your inventory and grow your bottom line.

Customize the Customer Experience

Shoppers have their heads on a swivel these days; just doing a quick 180 spin will yield dizzying numbers of stores offering the same, or similar, items. So how can you make sure that these shoppers choose YOUR store or YOUR brand over the other available options?

Make them feel special.

Offer promos, coupons, loyalty points and more that are geared toward that specific customer. One size fits all doesn’t apply here; you will have to implement some workflows in order to know who wants what and how they want what they want. Find out how to fill their needs.

The way to learn  who your shoppers are and what they prefer, you will need to dive into your POS data. This information is more incredibly valuable than one would think – you can form a pretty complete picture of your customers by examining your point of sale data, or rather, reports compiled from said data. We do that.

Targeted ads are also an obvious option. For ads to work, however, you have to make sure that you are placing them appropriately. If a customer has never in their life bought a pair of 12-inch garden shears, why would they want one now? Maybe that person has been researching gardening tools & techniques, therefore, this sort of ad would be appropriate. However, if the consumer had been searching for say, high-end luxury jewelry, they likely don’t care to see an advertisement for gardening tools. Data can help with that, too.

We know that your goal is the same for each individual customer – to provide value that is relevant to them and that meets their specific needs – so we make it our life’s mission to help you get your customer’s loyalty and satisfaction. Data analytics are invaluable to a brand such as yours. You can simply open your dashboard and begin checking out the reports you’ve received from Accelerated Analytics and then decide which actions to take that will be in the best interest of the shopper and your bottom line.

Increase Sales with POS Data

Photo by Justin Lim on Unsplash

Foster lasting relationships with your customers

Consider this:

Matt Mansfield (smallbiztrends.com) reported on December 26, 2018 that repeat customers spend 33 percent more than new customers and that a 10 percent increase in customer retention levels results in a 30 percent increase in the value of the company. Additionally, the average repeat customer spends 67 percent more in months 31-36 of their relationship with a business than they do in months 0-6.
 
Still not convinced?

Customer service.

47 percent of customers reported that they would take their business to a competitor within a day of experiencing poor customer service. This number has fluctuated to as high at 89% at times, illuminating the fact that it’s just too risky to take your customers for granted. Your business exists because of customers. No buyer, no seller.

Making sales is the goal. It’s great to make sales, and it’s important to make sales.
However, even a steady stream of one-time sales can lead to stagnation and the loss of growth opportunity. Over time, you’ll need to convert a portion of these one-time sales to loyal customers. Repeat business is proven to improve retail sales performance in the long-term, and that’s not even necessarily taking into consideration the word-of-mouth aspect of new customer acquisition.

One thing to consider implementing is a POS-tracked customer loyalty program. The premise of a loyalty program is that customers will keep coming back if you’re offering them better deals based on how much they spend with you or how often they visit your business. Such a program is not just a great way to encourage repeat business and nurture a relationship with your customer, but when taken in combination with other factors, like inventory, it also helps you to get a fuller picture of shopping trends, your customer base (demographically), and much more. Your POS system is actually a gold mine.

Customer Experience

Photo by Sara Kurfeß

Don’t brush off social media

Social media is your friend. Not only is just about everyone on it, on one platform or another, but, let’s just say it how it is – the cost begins at FREE. Such an easy-to-use and cost effective method of marketing your business, brand, service, etc. cannot just be ignored. Also key is the personal touch social media offers. You can engage with your customers and potential customers directly through posting on social media in the form of polls, videos, comments, chats, etc. Engaging your followers tends to become a snowball effect, gathering more and more interest as long as you keep moving (posting). You can post special offers for your Twitter followers, announce sales early to your Facebook fans, or talk shop with your LinkedIn connections. There’s the visual aspect, too. Enticing photographs of your merchandise can be posted to Instagram, special codes can be shared to your Snapchat adds…there’s really no limit to what you can do on social media. Simply getting your name in front of such a large audience is invaluable. And for the low price of free, it’s a win-win.

One final note: Mix it up! Take full advantage of social media. Write blogs. Run ads. Develop a loyalty program. And for the love of the shopping gods, keep your numbers in check. Utilize a reporting system to make sure you’re on track with projected inventory levels, sales numbers, staffing, etc. This will save you a lot of money and a LOT of headaches in the long run.


Learn more about how Accelerated Analytics can help you keep your numbers on track and grow your business. Or, contact us directly. We can answer your questions, schedule a demo of our reporting services, and make recommendations based upon the size and scope of your company.


Find more shopper statistics here:

https://blog.fivestars.com/26-statistics-that-prove-repeat-business-is-where-its-at/ 

https://smallbiztrends.com/2016/10/customer-retention-statistics.html

Generational Differences in Your Retail Consumer Base

Digital Dealer

Buy Now

Generation Z Retail Shoppers

Photo by Robin Worrall

If it seems like Generation Y consumers are always shopping with their phones, well, they are. New research from GfK shows that 73 percent of those ages 29-38 report using a smartphone for shopping over the last six months. That’s compared with just 33 percent of baby boomers (ages 54-72) and 59 percent of Generation X (ages 39-53). Boomers are still most likely to use a home computer or laptop, GfK reports, and Generation Y is the most likely of the generations to use a tablet.

The report, part of GfK’s FutureBuy series, also notes that younger shoppers are more enthusiastic about mobile payment. More than half of those in Gen Y and Gen Z (ages 19-28, combined) find mobile payment easier, faster and more efficient than other methods; just under half say they prefer to pay with a mobile device. For boomers, those numbers are substantially lower, with only 11 percent favoring mobile payment.

One thing that is consistent across generations — and might be of note to retailers — is concern about the perceived risks of paying by mobile, felt by 57 percent of Gen Z and 61 percent of boomers. – NRF STORES

Know your consumer base

 “In the quest to build relationships with shoppers, your executions need to consider the generational profiles of your target. Programming that might be highly encouraging to a Gen Y shopper risks falling flat with a boomer. Knowing your audience has never been more important.” Joe Beier, GfK executive vice president of consumer insights

Do you know your shoppers? Can you specifically accommodate Gen Z? Baby boomers? Millennials?

Surely you have some knowledge about differences between generations. It’s easy to spot the differences through everyday life; you’ve almost certainly gained some familiarity through magazine/news articles, listicles, Internet chatter and pop culture – even a television show called Survivor: Millennials vs. Gen X. Based upon what you’ve heard/seen/read, can you identify the different generations based upon their shopping  habits?

In the year 2000

Millennial Retail Shopping

 Sara Dyer, Alabama Media Group

Right around the turn of the century, the subject of generations working together in the workforce was a source of a new kind of curiosity.  Considered a unique situation not observed at any time in the past, the multi-generational workforce was the subject of many published studies by curious researchers. The consensus reached by these researchers is that this perfect storm has occurred due to two chief simultaneous occurrences:

  1. older generations are living and working longer; and
  2. younger generations are entering the workforce sooner in life.

Why?

Purpose. A large portion of Baby Boomers won’t willingly retire until they have some other purpose to serve. When they do retire, they leave their job roles open to the next generation to fill; however, the generation following the Boomers, Gen X, is the smallest of all generations (so far). More open jobs + not enough Gen X-ers to fill them equals opportunity for Gen Y-ers to vie for the promotions that will put them into those roles. Hence, younger generations are influencing the culture of the workplace sooner than preceding generations.

Then and Now

Generation Z in Retail

Saved by the Bell, 1989 – 1993

The documentation produced by the studies of 2000-2001 proved to be useful in helping different generations learn to understand each other at that time. This documentation, while interesting and helpful, did not seem to account for demographics or personal/familial history, which are HUGE factors in shaping how an individual prioritizes his or her next move. However, the studies proved to be a good jumping off point, and evolving studies will help to form a more complete story. Think about how vastly different the 90s were from the 2000s. Many things affected society that nobody ever even considered before, such as 9/11, technology and how we use it to stay constantly plugged in, a popped housing bubble followed by a deep recession, the first black US president, and so on. These events have changed the way we see life as a whole, our values, and how we each individually live our day-to-day lives. It makes you wonder what is to come in the next decade that we haven’t even thought of yet, how it will continue to change society, and how people in different generations will keep up with the constant evolution.

Going Forward

The world certainly seems smaller these days. However, perception still differs from person to person, depending heavily on upbringing, demographics, beliefs, age etc. Differences in outlook are not meant to drive a wedge between different groups of people, but instead to drive empathy, interaction and understanding. The retail landscape depends on different outlooks coming together to fill everyone’s shopping needs. While generational stereotypes exist, it’s important to avoid automatically categorizing consumers based upon their age, just as we know to avoid stereotyping consumers by skin color, gender, disability, etc.

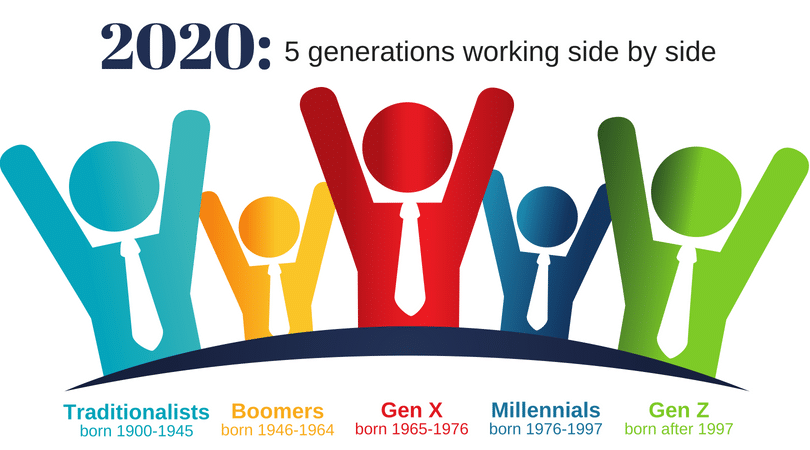
That said, the evolution of society continues to snowball, resulting in varying opinions regarding beginning and ending dates establishing generational boundaries. According to Kent State, researchers now describe the post-1980 generations in three groups, based on a number of certain factors.

The dates below are averaged ranges from a handful of studies.

  • Gen Y – born 1980 – 1985
  • Millennials – born 1986 – 1995
  • Gen Z – born after 1995
Gen Z Retail

Photo by Julián Gentilezza

The biggest societal jump happened between Millennials and Gen Z with the rapid evolution of technology. Admittedly, we as a society have a marked tendency to define the generations by their use of technology. The defining categorizations are as follows:

Gen Y are tech literate. Close to late teens/early adulthood during the advent of rapid technological advancements, Gen Y has adapted to the technological landscape, but can fondly remember a childhood before the tether of the Internet and mobile devices.

Millennials are techsavvy. The most staggering leaps in technological advancement happened during the formative years of Millennials’ childhood.

Gen Z are digital natives. Unlike the Millennials before them, Gen Z kids were born into the majority of advanced tech of today, and played with tablets and smartphones rather than ride bikes and climb trees.

Gen Y and Millennials learned technology as it became available to them. As such, best practices for use were not yet established, causing unforeseen havoc as technology continued to advance to the point that private information posted on social media began to creep into the professional lives of unsuspecting young professionals when employers began ‘social-stalking’ employees and prospective employees to help determine employment viability. Digitally-native Gen Z-ers, however, grew up with the lessons (learned the hard way by their Gen Y and Millennial parents) and thus are inherently smarter with privacy, info sharing, discernment of clickbait, catfishing and fake news sites, than their predecessors.

Of course, we are still learning on our feet. Gen Z is working its way into the workforce and therefore into the retail landscape. As we continue to learn by trial and error, we’re taking notes and learning to adjust and adapt quickly enough to satisfy the needs of all consumers – that’s the goal, anyway. From differences in preferred means of communication (where do you market your products or services to each generation? Email? Traditional mail? Snapchat?) to rapidly changing everything, the perceptions and experiences of each generation are important ingredients to forming and figuring out what’s next – not just in retail, but in all parts of this thing we call life.


Sources: Stores.org, NRF’s online magazine; Kent.edu

What Is A Sales Cycle And How To Master Every Stage

While the definition of sales cycle can differ depending on whom you’re talking too, essentially it refers to the process that a company uses to obtain a new customer. It includes all activities associated with closing a sale. These steps and processes in a sales cycle can differ from one company to the next, depending on exact steps a company takes when closing a sale.

Sales cycles can differ a lot, especially when it comes to specific industries. This is because the definition that does exist has different variations. For example, some people define it as when a qualified prospect is brought in and closed. Others suggest it’s the time it takes from starting from nothing to closing a deal.

Regardless of what definition you use, knowing how your sales cycle works is key to fully optimizing your sales process. You can’t improve your sales process if you’re not tracking it, so step one is tracking this cycle.

Why Is The Sales Cycle Important?

Tracking your sales cycle will allow you to collect business insights into the efficiency of your sales operations. Why is this important? Well, the length of this process can be audited, analyzed, and compared to the standard length across your specific industry. If your cycle is shorter than industry averages, this could reflect that your company sales department is more effective than competitors.

Generally speaking, having a fast sales cycle is a good thing. The longer the cycle, the greater the opportunity for sales to fall through. If there are strategies that can be implemented to shorten this cycle, it’s often recommended.

Sales cycles can also vary by campaign, so it’s not uncommon to have multiple sales cycle within a company.

What Are The Stages Of Sales Cycles?

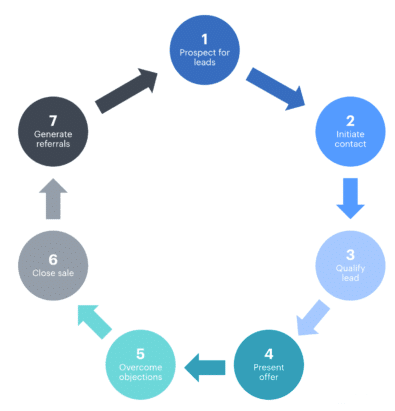
Sales Cycle StagesIt doesn’t matter what you’re selling – every sales cycle contains stages. These sales cycle stages can vary depending on the industry your company serves, so keep that in mind as we reveal each stage.
  1. Prospecting And Lead Generation
  2. Initial Contact, Building A Relationship
  3. Identifying Prospect Needs And Qualifying
  4. Presenting An Offer
  5. Handling Objections
  6. Closing The Sale
  7. Getting Referrals

While your cycle can differ, the majority of companies are going to have a sales cycle with some of these same core pillars in place.

(1) Prospecting And Lead Generation

One of the most important steps in every sales cycles is a company’s ability to build high quality leads and prospects. With advancements in technology, building an automated lead generation sequence is easy. Prospecting is easier, too, as many potential customers are engaging with brands online, especially through social media.

(2) Initial Contact, Building A Relationship

Successful companies give their audience multiple ways to engage with their brand, leading to more opportunities to engage prospects and build an authentic relationship with them. Depending on the industry you serve, this stage can be hours, days, weeks or longer.

(3) Identifying Prospect Needs And Qualifying

At this point in the sales cycle, you have one goal: identify your prospects needs. During the same time, you want to begin qualifying your prospects, too. Usually at this point, the prospect has scheduled an appointment or strategy session.

(4) Presenting An Offer

Once a prospect has been qualified, you can then provide a solution to solve that problem. This is where you present your offer to the prospect. Some companies may only have one offer, while other companies may present multiple offers during this stage of the sales cycle.

(5) Handling Objections

If you’ve been on a closing call or strategy session, you know the prospect will likely have objections they need to overcome to become a customer.

(6) Closing The Sale

Once you’ve qualified the prospect, handled objections and presented an offer, it’s time to close the sale.

(7) Getting Referrals

Referrals are important to all companies, so make sure you ask for referrals after you’ve closed the sale.

Tracking Your Sales Cycle

The data you collect during the sales cycle is going to allow you to optimize all areas of your sales process, but only when you’re tracking everything.

Here are a few important KPIs to consider.

  • Which lead magnets are generating the most qualified leads?
  • What’s the most common objection prospects have about our service?
  • How long does it take on average to close a new client?
  • What are the most common questions we’re being asked about our offer?
  • Which age group is responsible for the most completed sales?

These are just a few of the insights you can gain by tracking your sales cycle, providing you with the data you’re going to need to improve your sales cycle.

For example, if our company averages 60 days from the first contact to a sale, I want to know how we can do it in 45 days.

If I have 3 lead magnets and one is converting leads at 50 percent, I want to know why that’s happening so I can improve my other two.

As long as you’re tracking your sales cycle, it gives you the opportunity to optimize your cycle and make it better.

POS Reporting

If you want to take your sales reporting to the next level, Accelerated Analytics can help. Sales are the lifeblood of your business and sales data can get complex. Your sales data doesn’t have to be complicated. Your POS data can give you valuable insights to your company’s sales performance.

What Is Supply Chain Management?

computer weekly

Supply Chain Management (SCM) refers to the complete range of activities needed to plan, control and execute a product’s complete journey, from the purchase of raw materials and production through distribution to the customer receiving their order, in the most efficient and cost-effective manner possible.

If a company wants to compete in international and global markets, they must master their supply chain and networks.

Supply chain management involves the planning and execution of multiple processes that must be implemented to optimize the flow of materials, information and financial capital in the areas that broadly include demand planning, sourcing, production, inventory management and storage, transportation — or logistics — and return for excess or defective products.

Supply chain management also integrates supply and demand management within and across companies. It can include numerous self-organizing networks of businesses that work with one another to provide service and product offerings to customers.

With SCM, companies need the right software and strategies to gain an advantage versus the competition.

Supply chain management is complex, it relies on a number of different partners to run efficiently and effectively. Manufacturers, suppliers and fulfillment, it takes an equal effort from all parties to stay organized and completing tasks. Due to this, effective supply chain management also requires change management, collaboration, risk management, resources and technology to create alignment and communication between all parties.

Supply chain sustainability covers social, legal and environmental issues, as well as sustainable procurement too. All of these are closely related, focused on the pillar of corporate social responsibility, which analyzes a company’s effect on the environment and their social well-being.

Supply Chain Management vs Logistics

Two terms that are often used together but commonly confused is supply chain management and logistics.

While there’s certainly some similarities, logistics is actually a component of supply chain management. Logistics concentrates on moving a product or material in the most efficient way, ensuring it goes to the right place at the right time.  It includes activities such as packaging, distribution, warehousing, transportation and delivery.

Now, supply chain management involves a larger range of task, such as procuring the best possible prices on goods, sourcing raw materials, procuring the or coordinating supply chain visibility across your supply chain network of partners.

Benefits Of Supply Chain Management

Supply chain management has a number of different benefits for your company. For starters, it molds efficiencies, helps increase profits, lowers costs and boosts collaboration. SCM is vital to your business as it allows companies to efficiently manage demand, carry the right amount of inventory, deal with disruptions, keep costs to a minimum and meet customer demand in the most effective way possible. These SCM benefits are achieved through the appropriate strategies and software to help manage the growing complexity of today’s supply chains.

The Complexity Of The Supply Chain

The most basic level of a supply chain includes a company, their suppliers and the customers they serve. As an example, the chain could look like:

  • Producer Of Raw Materials
  • Manufacturer
  • Distributor
  • Retailer
  • The Customer

This is a base supply chain that could work.

When you begin diving deep into a complex supply chain, it can include a lot of different moving parts. A complex supply chain could include many suppliers, even suppliers to suppliers. It can include providers such as third-party logistics (3PL), supply chain software providers,  financial companies, even collecting goods for recycling. It can include many organizations, what ever is required to get products to your customers.

When you have such a complex supply chain, things can go wrong. There’s many things that a company must be aware of. For example, a new product can be released and that may cut demand for the older version of the product. You may have to deal with seasonal holidays, which is often a stressful time for retailers trying to keep product on the shelf. Weather events can also play a role in your supply chain.

Why Supply Chain Software Is Vital

Every company wants a competitive advantage and your supply chain is an area you can optimize. In today’s technological world, supply chain software will play a role in your success.  ERP vendors offer a wide range of solutions for you to focus on key areas (or more) of your supply chain. You’ll also find business software vendors that solely focus on SCM.

Supply chain management software consist of modules and tools that are used to execute supply chain transactions, control business processes and manage supplier relationships. Having this software in place is key to management.

There’s a few key solutions you may want to consider.

  • Supply Chain Visibility Software – Will help you with spotting and analyzing risk, also allowing you to manage them.
  • Supply Chain Planning Software – This will allow you to manage your demand.
  • Inventory Management Software – Allows you to track all of your inventory and efficiently optimize inventory levels.
  • Supply Chain Execution Software (SCEM) – Helps with your day-to-day manufacturing operations. It considers all possible events and scenarios that could disrupt your supply chain.
  • Logistics Management Software – Gives you the ability to track the transport of goods, even globally.

Today, your supply chain plays a bigger role than ever.

The growth of ecommerce and the demand to get products to your customers as quickly as possible has fueled today’s supply chains. While there’s an endless array of options, it also presents challenges for your company as well.

There’s many areas of your SCM where ground can be made, cost can be cut and the input of productivity increased. However, while you have much to gain, there’s also many challenges you’ll face. This is why the right “technology” and “data” is invaluable.

Technology, especially big data, predictive analytics, IT technology, supply chain analytics, robotics and autonomous vehicles, all of these are being used to solve those challenges, reduce risk and avoid disruptions to your supply chain.

Other Terms Related To The Supply Chain

Here’s a few more terms you want to get familiar with that relate to the supply chain.

  • Value Chain Definition – A value chain is a tool that analyzes all the activities a business uses to create a service or product.
  • End To End – The end-to-end term refers to solutions or products that cover the entire length of a specific process.
  • Operations Management – This is the administration of best business practices to create the highest level of efficiency possible within the company.
  • Inventory Management – This is the process of ordering, storing, tracking and using a company’s inventory.
  • Project Management – Project management involves organizing and planning a company’s resources to move a specific task, process or event toward completion.

Retail and Artificial Intelligence: What’s Next?

Retailers are constantly talking about the future, but what technologies are going to take them there?
Retail Artificial Intelligence

When we think about innovations like chatbots, personalized product recommendations, dynamic pricing and programmatic display, there’s one common denominator. All of these are great examples of how artificial intelligence can be a game-changer for a multichannel retailer.

Over the next three to five years, AI will play a significant role in the multichannel retail market. It will help differentiate the winning organizations, as well as determine which ones close their physical and digital doors.

It’s easy to think of AI as a buzzword, but based on a study of more than 13,000 consumers, brands with the most sophisticated, personalized customer experiences have higher satisfaction and Net Promoter Scores, as well as higher retention. Using AI, machine learning and technology to highlight what makes the brand and their buyers unique is what sets apart retailers like Sephora and Nordstrom.

Global retail sector technology spending is expected to grow 3.6% year-over-year to reach almost $203.6 billion this year. Similar spending is projected for the next two years as well, with the fastest-growing category being software. As consumer expectations for highly-connected experiences continue to increase, it’s critical for retailers to become versed in how to buy and apply AI — and quickly.


This post is based on an article written by Jason Grunberg for SailThru.

International Builders’ Show 2019

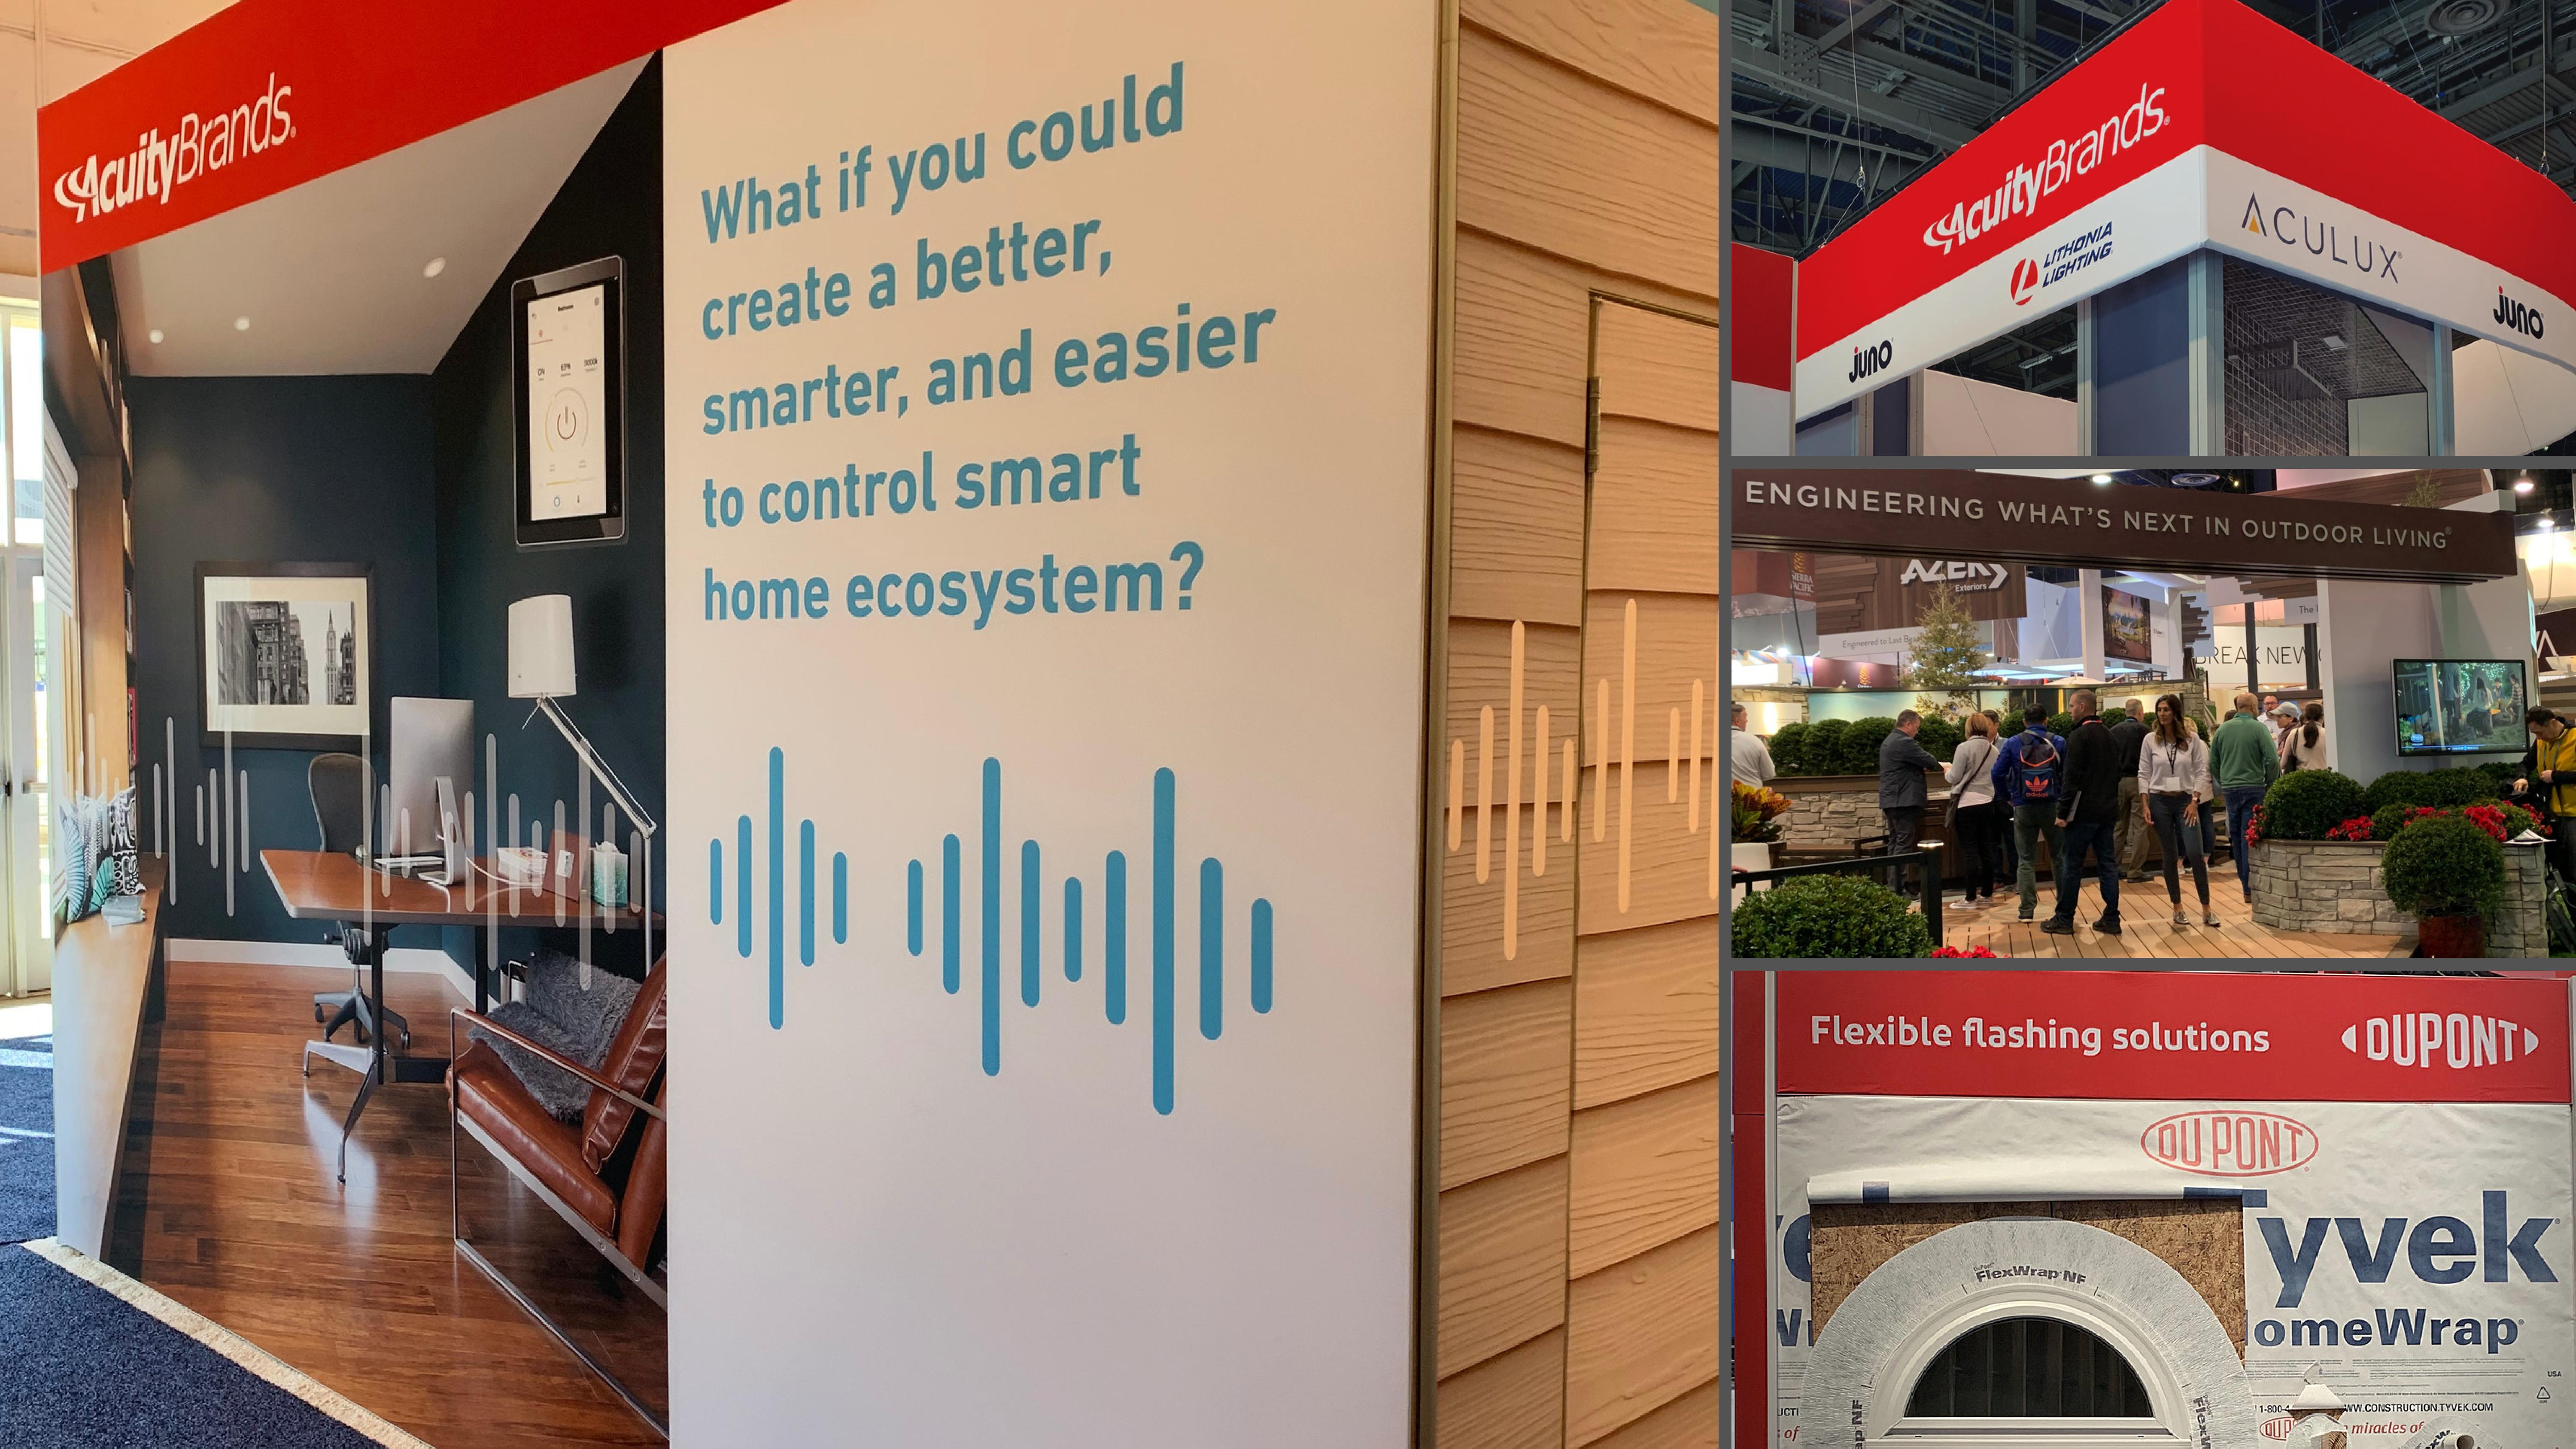
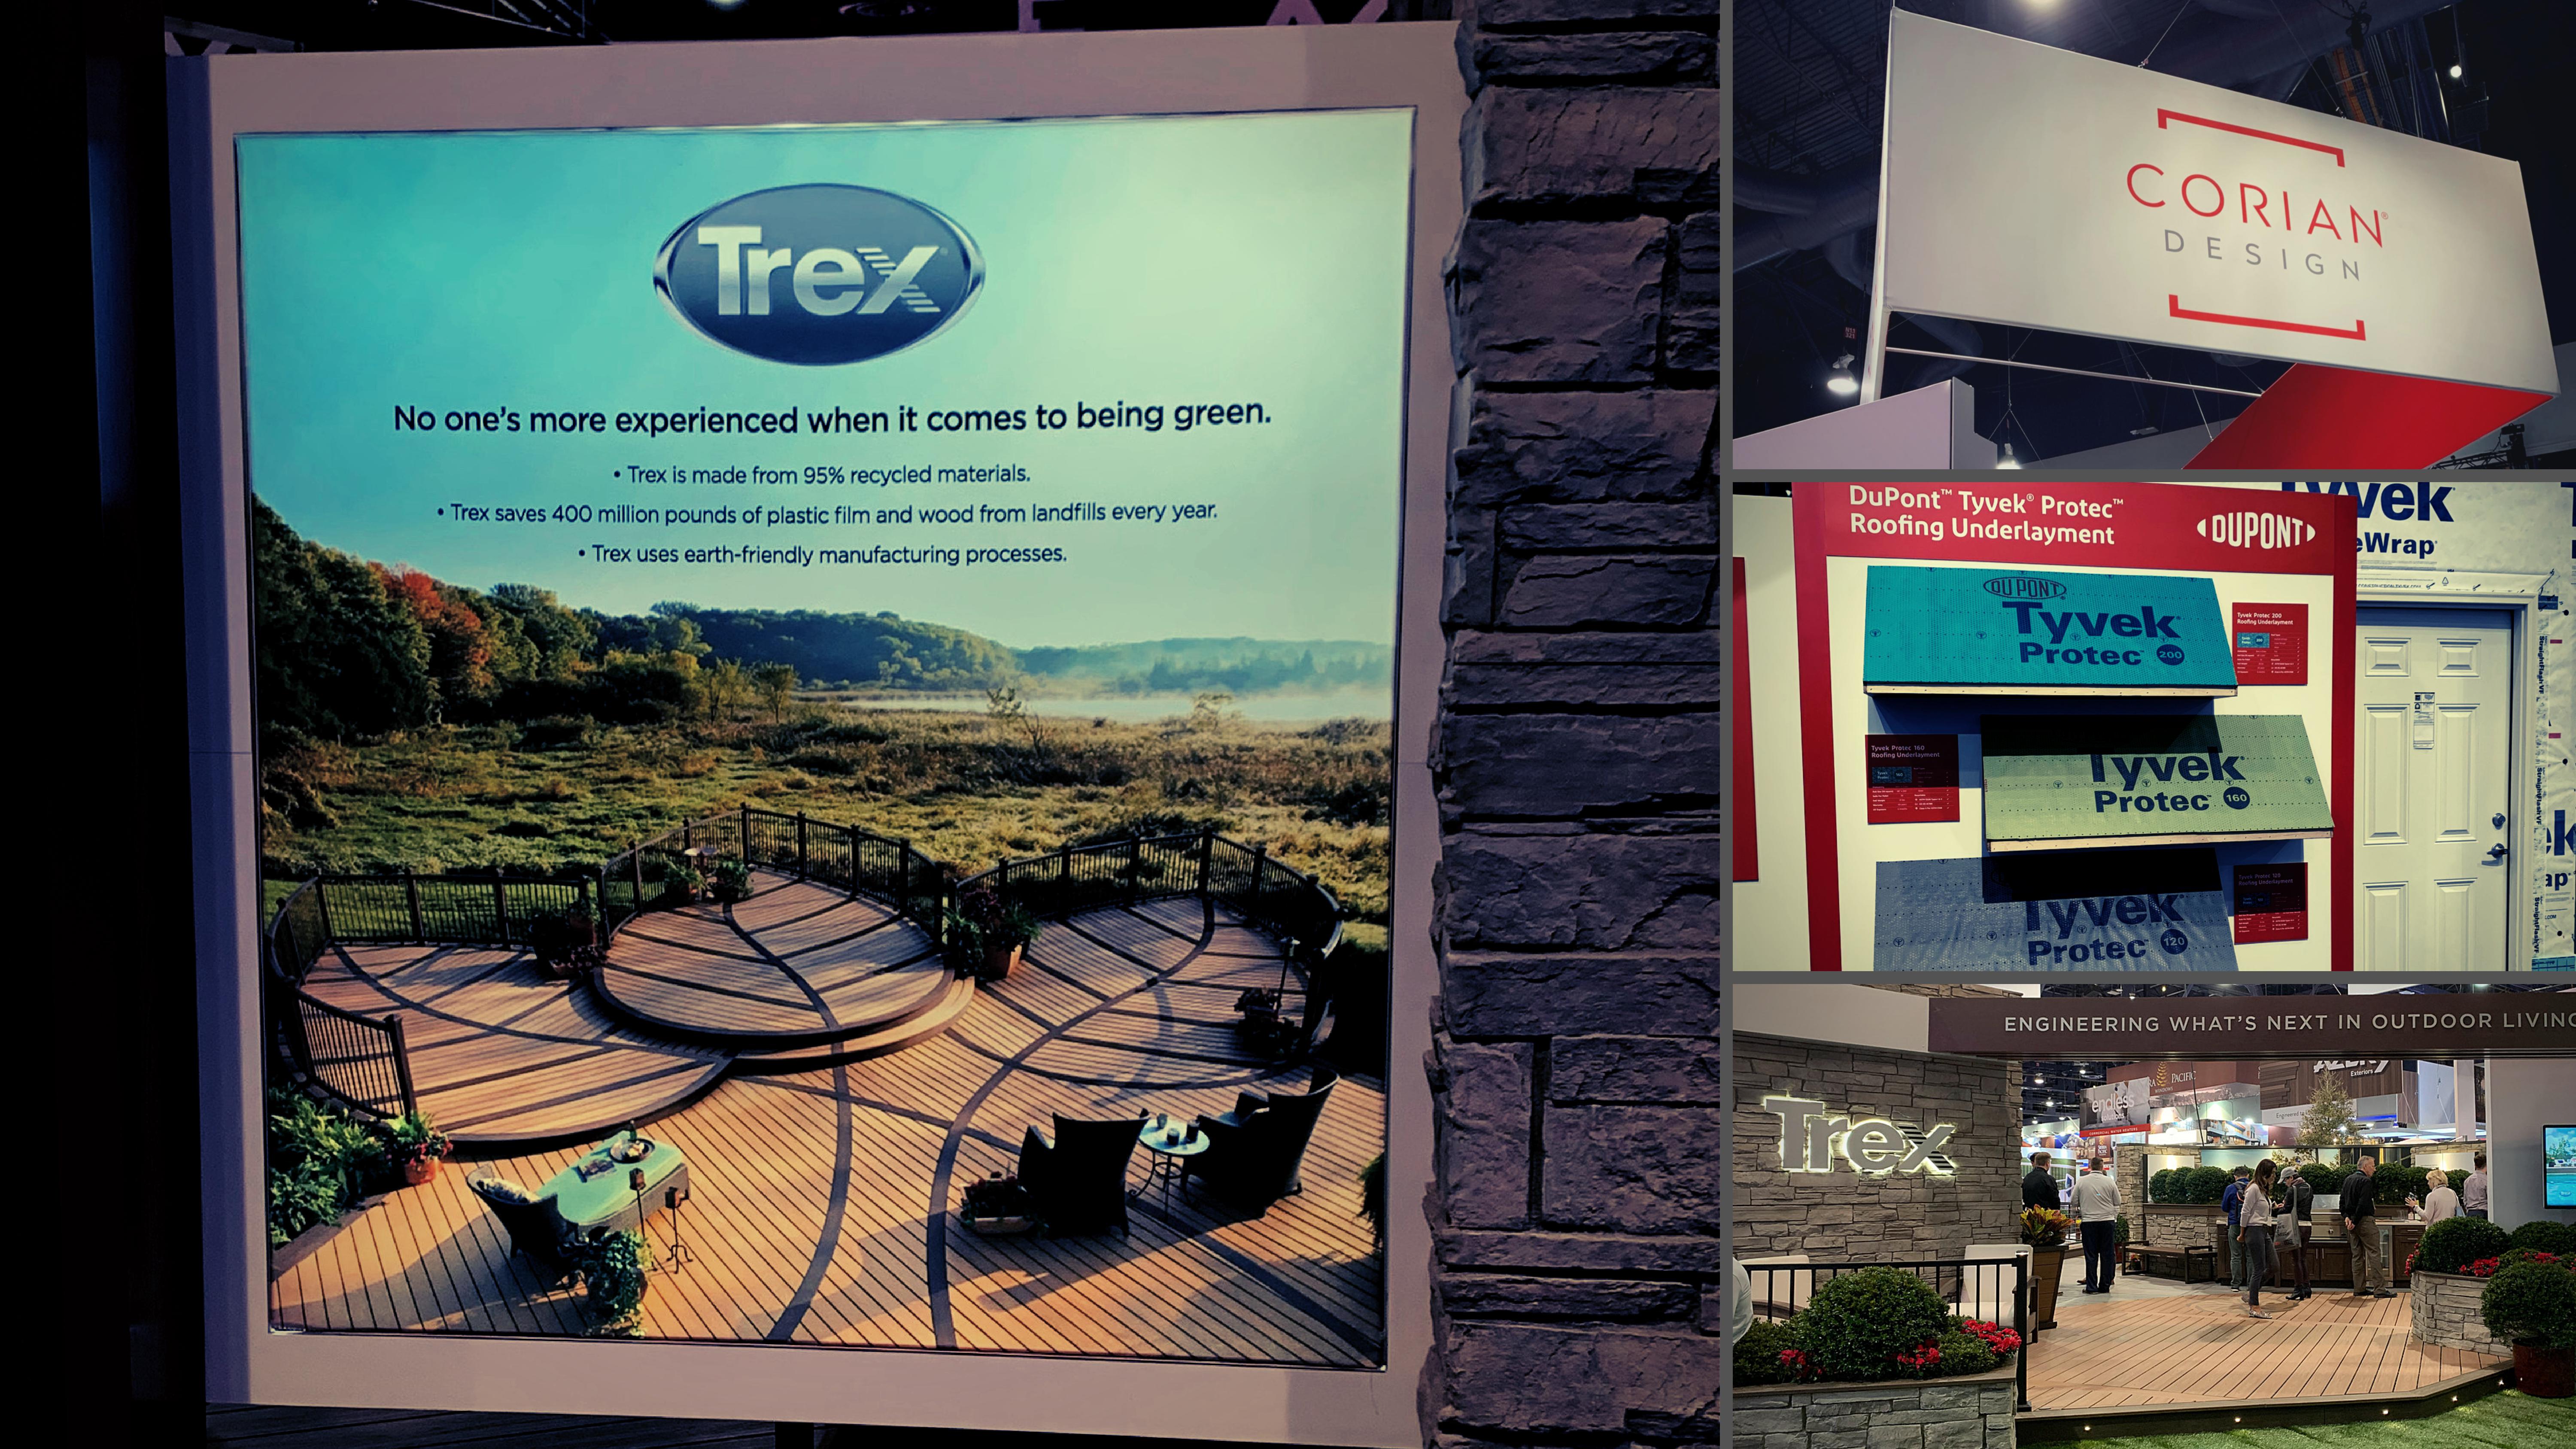
Featuring more than 1,500 exhibitors, the 75th annual International Builders’ Show, held February 19-21, 2019 in Las Vegas, proved to be the biggest in a decade, proving to us that the home building industry continues to flourish.


2019 International Builders ShowThe show was part of Design & Construction Week®, which saw more than 100,000 attendees. The IBS exhibit floor covered more than 600,000 square feet, where attendees browsed the latest home technology products, watched live interactive building demonstrations, participated in over 125 education programs presented by thought leaders in the industry, enjoyed happy hours, music (the closing concert welcomed the Goo Goo Dolls!), comedy (opening ceremony featured Dana Carvey as well as Blue Man Group) and networking with the best in the industry while collecting IBS swag along the way.

International Builders ShowWith roots tracing back to the 1940s, the International Builders’ Show now celebrates 75 years of home building, products and innovation with over a million square feet of space offering numerous events and new features including the Wood Flooring Pavilion and the Jobsite Safety Zone, which provided safety demonstrations, microlearning sessions and networking opportunities.

Classic IBS favorites made a return, including:

  • High Performance Building Zone: Live interactive demonstrations to improve efficiency in all areas of the house.
  • The Centrals: Comfortable lounges dedicated to specific market niches including remodeling, custom building, multifamily, 55+ housing, international, design, and sales.
  • Pavilions and Special Interest Areas: The newest trends in home and business technologies
  • Outdoor Exhibits: Entire homes are constructed especially for the show. The light dusting of snow couldn’t keep us inside!

Other events included industry awards, all-stars celebration, green home tour, awards gala and more.

Click here to read the full recap of IBS75

2019 International Builders ShowInternational Builders Show#IBS2019 #IBS75years


Using your POS Data to Maintain Optimal Inventory Levels

Cin7

POS Data for Inventory Management

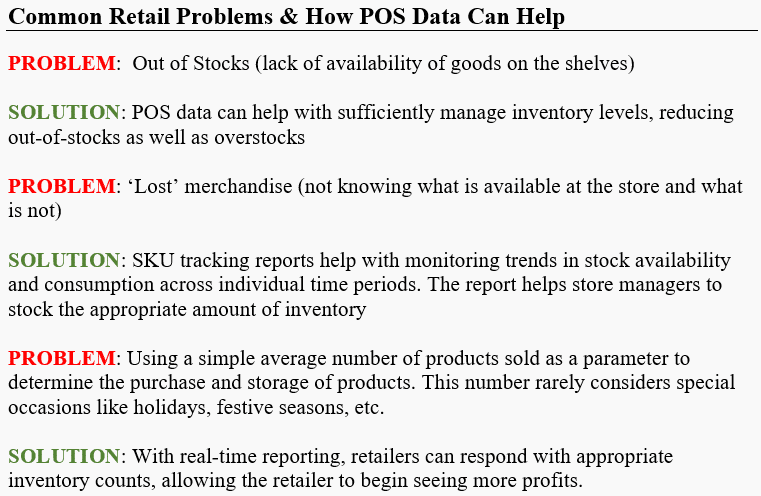
POS Data:

More than Numbers

Companies can draw insights about consumer behavior using POS data, which defines an intricate correlation between purchases, inventory, seasons and other contributing factors. These sets of data hold a lot of value, but in raw form, the information can be difficult to work with; after being cleaned up and formatted by a team of analysts, the data can be considered usable.

Inventory Can Make or Break Your Brand

The O-Bomb: Out of Stocks

Out-of-Stock (OOS) is a dangerous phrase among retailers, since it slows sales when real demand strikes. POS data reveals a trend that tells which of the products are in demand at what time during a day, week or year. This helps retailers prioritize stocking the right products in their stores. The biggest advantage you can enjoy as a retailer is to also manage different product categories with enough stock, seamlessly. Hourly sales data with significant gaps during peak sales periods would determine how to tackle with OOS issues to every detail.

Sales Trends

POS data provides the sales and profits earned from each store. optimizing the productivity of a store can help boost the profitability of each store. The comparable data of how revenues are occurring is easily accessible from POS data. It enables productivity at a granular level, which helps to get to the details of each product, category, shelf and store.

Promotional Events

By utilizing POS data to its fullest, retailers can make more accurate decisions in a shorter amount of time. The promotion is optimized to perform well; thanks to POS data reports, management knows exactly what is happening at the points of sale, how consumers are responding to specific promotions, the effects of outside factors like weather, holidays, local events, etc. As more data is gathered and utilized, it is possible to produce calculations of ROI – calculations that can help to plan & execute future promotions. Promotional pricing can be optimized using this data, as well.

Overcoming Challenges in Inventory Management

How Accelerated Analytics Can Help:

SUPPLY CHAIN AND WAREHOUSE MANAGEMENT
Sending your goods to distributors and retailers doesn’t necessarily mean that it will make it into a customer’s cart; events such as returns, exchanges and refunds interrupt the flow of sales cycle. POS data helps predict trends around such interruptions, creating a more unified flow of distribution and sales.
The POS data further helps to gain deeper insights into consumers by analyzing which specific products they are buying and what products are bought together. This information helps retailers plan for future promotions, as well as planning store layout by putting together products likely to be bought together.

RAW DATA IN -> COMPREHENSIVE REPORTS OUT -> BOTTOM LINE SUCCESS
POS data is a gold mine for retailers to understand consumer behaviors and the impact of sales at each store, but even though most retailers collect and store POS data, they don’t know how to make it work for them. Harnessing such large data sets require powerful, deep analysis, so it’s best done using advanced analysis tools. Our predictive and prescriptive software can transform and assimilate POS data and other raw data into actionable insights – insights that will ultimately result in more sales, thus a better bottom line.POS Data Reports

How Gen Z is Changing the World of Retail

The latest generation of consumers
is prompting retailers to re-frame their thinking about the customer experience today compared to what it was just
a decade ago.
Technology is changing the way we shop, thanks to the knowledge, habits and expectations of the generation we
know as Millennials – they’ve driven big changes to business worldwide.

But Millennials are no longer the youngest generation of consumers. The next generation, known as Generation Z,
is coming up quickly on the heels of Millennials, and these consumers have already begun to bring even bigger
changes – and challenges – to retailers. Millennials made an enormous splash when they became independent
consumers, and Gen Z-ers – the first ‘digital natives’ – are disrupting the world of retail now.

Gen Z-ers (born between the mid-90s to mid-2000s) are 26%32% of today’s population, the largest single
segment, and they don’t remember life before mobile phones, social media or the Internet. This tech-savvy culture
means that these shoppers have no patience for any retail/marketing trickery, and it’s very important for retailers
to remember this; unlike previous generations of kids whose retail preferences were not heard or heeded, 93%
of parents of Gen Z-ers say they actively influence family purchasing decisions. They also make said decisions with
heavy influence of social media platforms; with their mobile devices at the ready, this global population of
2 – 2.5 billion (and 70 million in the U.S.) hold up to $143 billion in buying power.
Because of the significant influence Gen Z has as shoppers—even the youngest among them–retailers are beginning
to realize the generation’s disruptive impact before other business sectors.

What Retailers Should Know About Generation Z

Gen Z and Retailers

The majority (77%) of Gen Z-ers prefer to shop
in brick-and-mortar stores.
Creating the right in-store experience is crucial. From offering personalized customer service
to ensuring items are in stock, retailers can make a positive impression on this desired demographic—because they may not
get a second chance. That said, astute retailers unify their physical stores with the online world. Deeper data mining
allows brands to use factors such as social influence and digital behavior to cater to the consumer.

Gen Z shoppers expect a seamless digital-to-physical experience. This generation relies heavily on mobile devices and
expects fast-loading websites and an omnichannel experience. If they research an item online, then go to the store to see
the item, they want that integration to be seamless and cohesive.

Gen Z-ers consider value over cost. Unlike the millennials before them, Gen Z-ers are careful with their funds. They’ll support
brands they believe in, but not to the detriment of their future. Watching their parents struggle through the recession has
made this generation wary of credit and debt, less prone to taking it on. Previous generations had a “buy now, pay later”
attitude – a concept that arguably caused the recession, so Gen Z is, thankfully, showing Gen Z Shopperssigns that they’ve learned from
the mistakes of their parents.

“Data is at the forefront of everything, and the customer is the center of everything.”
Janet Sherlock, Ralph Lauren CIO

Final notes

Information collected through foot traffic-monitoring
technology can be instrumental in giving retailers better insights to optimize store layouts to enable the consumer to find
what they are looking for. In addition to providing more detailed customer profiles, collected data allows retailers to more
deeply understand how consumers shop in the store, including what products and displays catch their eye and what they eschew.
Important: Although retailers use customer data for the benefits it can help provide to said customer, the retailer must be
transparent about the collection, disclosing the benefits it will provide customers (convenience, time savings, customized
recommendations, etc.) as well as what the retailer gets out of it.
These days, the collective expectation is that the shopping experience will be similar to social media interactions – tailored
and instantly attainable. To make the most of the eight-second attention span of the average Gen Z-er, retailers must embrace
and leverage the technology that is increasingly available and always evolving.