
Author: Chad Symens

What Is A SKU In Retail?

SKU - Stock Keeping Unit

If you can’t track it, you can’t measure it. For retailers, tracking inventory, sales and key retail KPIs are invaluable for success. Speaking of inventory, how do retailers keep track of all their products? Well, they use coding systems to keep track of their inventory and to measure sales. These codes are extremely important and can make the difference when stores need to know when reorder points should take place. They can help inform you when you need to add safety stock. They also allow retailers the opportunity to gauge which products are moving off the shelves.

By definition, a (SKU) or stock keeping unit is a specific number assigned to a product by the retail store to identify the price, product options and the manufacturer of the merchandise. SKUs are used to track inventory in your retail store. They are very valuable in helping you maintain a profitable retail business.

When accessed in your point of sale (POS) or accounting system, a SKU is a series of numbers that tracks unique insights related to that product. If you use a POS, you likely already know how important your POS data is.

SKUs are not universal, not like universal product codes (UPCs),  which means that each retailer will use their own SKUs for merchandise.

While there’s a number of different combinations SKUs can use, most of them are broken down into 2 groups;

  • Categories
  • Classifications

Many retailers will use series of numbers in their SKU to group products together for analysis. Due to this, we want to give you a few examples. We’ll go DIY on this one. For example, 35-10xxxx could be for a tool box and 35-20xxxx could be for a tool box with tools. The next number could be the identifier of the color. So, 35-10001x could be for a blue tool box and 35-10002x could be for the red tool box.

How Are SKUs Used?

When you break down companies that use SKUs like a Champ, Amazon reigns supreme.

For example, when customers begin shopping using a SKU, Amazon will auto populate related products based on your selections. Since the SKU has traits for each product, they know which products to display when you’re searching. Now, Amazon also has cookies that are much more intelligent versus that of the SKU, but stock keeping units are still useful.

Most POS systems will allow you to create your SKU hierarchy or architecture. Before you create an elaborate system for your inventory, consider what you will truly track.

For independent retailers, you’re likely not going to track beyond classification. For example, a watch store might classify watches based on customer type (men, women, children), style, color, and material.

Larger watch stores may use categories to break down the classifications more, such as Rolex types or trends. With an item’s SKU, a retailer is able to track its inventory and sales through detailed analytical reporting, such as POS analytics.

Have you ever been in a retail store and seen the associate scan the SKU or UPC label to see if there were any more in the stockroom? Inventory management is the core function of an SKU, but it can also improve the shopping experience of your customers. Being able to immediately identify your stock levels helps you take care of the customer faster.

While a lot of people don’t recognize it, another great benefit of a SKU is in advertising.

With such a large competitive landscape in retail today and many retailers matching prices, having unique SKUs can be the difference in higher profit margins.

*Accelerated Analytics publishes resources like this to provide insights to different analytical metrics, data points and formulas. Please be aware, we’re not claiming that our POS reporting services will offer this example or any other metric, data point or formula. To learn exactly what our reporting covers, please feel free to schedule a demo or give us a call. Thanks for understanding.
Calculating Your Breakeven Point

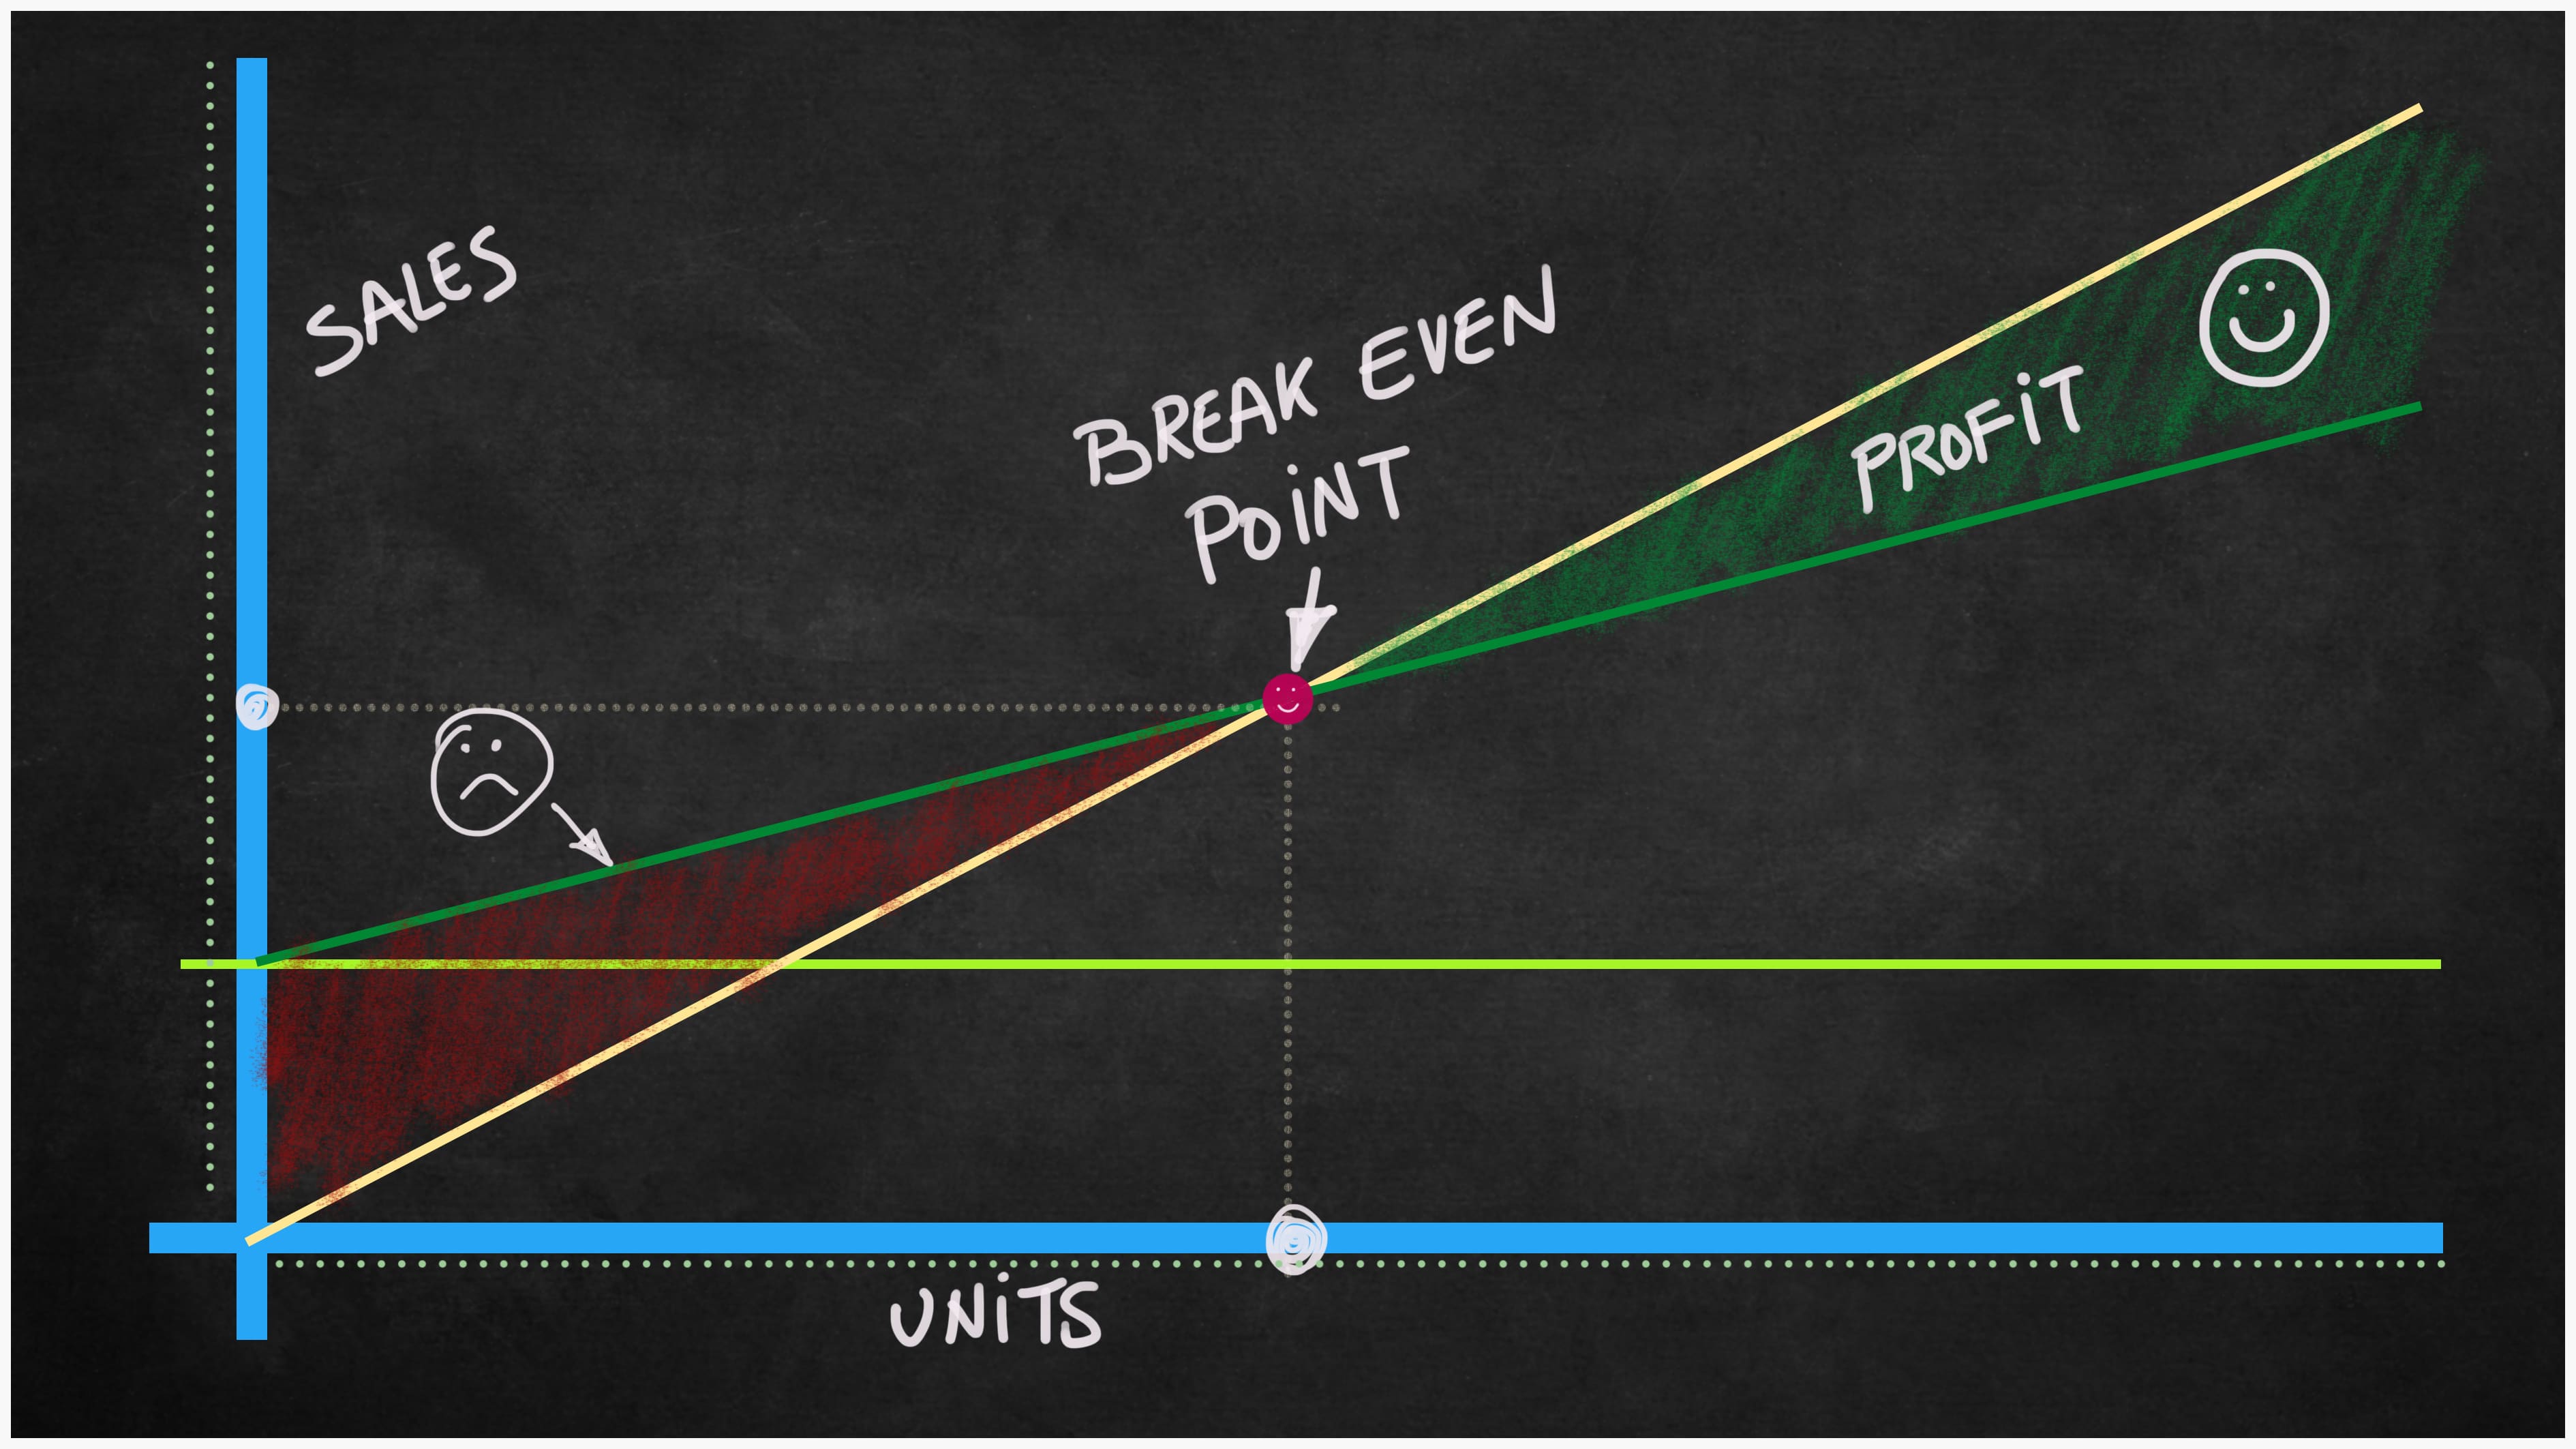
Breakeven Point Calculation

Having the ability to calculate your breakeven point is very important. After all, every unit sold afterward is profit, it’s a very important business metric. Once you know the fixed and variable costs for the product your company produces, you can then use that information to calculate your breakeven point for that specific product or service.

Small business owners can use the breakeven calculation to determine how many product units they need to sell at a specific price point to break even.

The Breakeven Point

A company’s breakeven point is the point at which it will cover all expenses related to that product by selling a unit at a specific price point. To analyze a company’s break even point in sales volume, there’s going to be 3 variables you need to know:

  • Fixed Costs: Costs that are independent of sales volume, such as rent
  • Variable Costs: Costs that are dependent on sales volume, such as the cost of manufacturing the product
  • Selling Price: The selling price needed to break even

How to Calculate Breakeven Point

In order to calculate your company’s breakeven point, you’ll need to use the following formula:

Fixed Costs ÷ (Price – Variable Costs) = Breakeven Point in Units

Now, the breakeven point is equal to the total fixed costs divided by the difference between the unit price and variable costs. With this formula, fixed costs are stated as the total of all overhead for the company, whereas Price and Variable Costs are stated as per unit costs, which would be ​​the price for each product unit sold.

The denominator of this equation, price minus variable costs, would be referred to as the contribution margin. After unit variable costs are subtracted from the price, the amount left (contribution margin) ​is available to pay the fixed costs for that business.

An Example of Finding the Breakeven Point

ABCD Company has calculated that it has fixed costs that consist of its rent, depreciation of assets and executive salaries. Those fixed costs add up to a total of $60,000. Their product is an ecommerce plugin. Their variable costs associated with producing the plugin includes raw material, labor and sales commissions. Variable costs have been calculated to be $0.80 per unit. The plugin is priced at $2.00 each.

With this information, we can calculate the breakeven point for ABCD Company’s product by using our formula above:

$60,000 ÷ ($2.00 – $0.80) = 50,000 units

What this answer means is that ABCD Company has to produce and sell 50,000 plugins in order to cover all of their expenses, fixed and variable. At this stage of sales, they would make no profit but will break even.

What Happens to the Breakeven Point If Sales Change

That’s a great question. What happens if your sales do change? For example, if the economy slows down, your sales might decline. If sales are down, you risk not selling enough to hit your breakeven point. In the example of ABCD Company, you might not sell the 50,000 units needed to break even.

In that case, you wouldn’t be able to pay all your expenses. This is a bad scenario to be in, what can you do? If you look at the breakeven formula, you can see that there’s 2 possible solutions to this problem:

  • You raise your prices
  • You cut fixed and variable cost

How Cutting Costs Affects the Breakeven Point

Let’s say you find a way to cut the cost of your overhead or fixed costs by negotiating a deal to cut your insurance by $10,000. In this case, your fixed costs drop from $60,000 to $50,000. Using the same formula and holding all other variables exactly as before, the breakeven point would then be:

$50,000 ÷ ($2.00-$0.80) = 41,666 units

In that case, cutting fixed costs allows you to drop our breakeven point.

If you reduce your variable costs by cutting your costs of goods sold to $0.60 per unit, holding everything else the same, you can see our breakeven point becomes:

$60,000 ÷ ($2.00-$0.60) = 42,857 units

From this analysis, you can see that if you can reduce the cost variables, you can also lower your breakeven point. In this example, we did it without raising the price.

How Fixed Costs, Variable Costs, Price, and Volume Relate

As the owner of a small business, you can see that any decision you make about pricing your product, the costs you incur in your business, and sales volume are interrelated. Calculating the breakeven point is just one component of cost-volume-profit analysis, but it’s often an essential first step in establishing a sales price-point that ensures a profit.

*Accelerated Analytics publishes resources like this to provide insights to different analytical metrics, data points and formulas. Please be aware, we’re not claiming that our POS reporting services will offer this example or any other metric, data point or formula. To learn exactly what our reporting covers, please feel free to schedule a demo or give us a call. Thanks for understanding.

 

Inventory Carrying Cost Formula

carrying cost

Inventory carrying cost, also referred to by carrying costs, is a term used in accounting that identifies all business expenses related to storing and holding unsold goods. This total figure would include all related costs of warehousing, salaries, transportation, handling, taxes, and insurance as well as depreciation, shrinkage, and opportunity costs.

If you’re a retail business owner, you likely already know how important inventory management is to the success of your company. If you’re a regular reader here at Accelerated Analytics, you’ve likely be learning which retail metrics you should be tracking, especially those metrics that come from your POS data.

Now, there’s a few key points we want to make before you get into the carrying cost formula.

  1. Inventory carrying cost is the total of ALL expenses related to storing unsold items.
  2. This total will include intangibles such as opportunity cost and depreciation.
  3. Inventory carrying cost generally average around 20-30 percent of total inventory cost.

Before you can calculate that cost, there’s a few terms you need to know.

  • Storage Cost – This is going to be all the cost associated with storing inventory. This can include rent, taxes, fees, insurance and utilities for storage. If you need controlled storage or climate storage, that would included too.
  • Handling Cost – If you have people shelving your products or items are being watched, you need to make sure you total these cost.
  • Opportunity Cost – If you purchase $50,000 in inventory, that means you can’t use that $50,000 for debt or investing. This metric is going to represent the cost of lost opportunity when calculating the cost of carrying inventory.
  • Deterioration / Obsolesence – If you carry inventory long enough, some items can depreciate in value.

How Do You Calculate The Cost Of Inventory?

To use an example, we’ll say we have a retail coin shop that sells collectible coins, gold and silver.

  • The average value of this year’s inventory is $500,000.
  • Our annual cost of storing goods are $100,000.
  • Our cost for unloading storage and bringing it to the store is $5,000.
  • Our opportunity cost is $20,000 as it was tied up in inventory.

Our inventory carrying cost above add up to $125,000, which include our cost for storage, unloading/delivery and opportunity cost. To calculate carrying cost, we divide $125,000 by $500,000 and our carrying cost is 25 percent.

Controlling Carrying Costs

If you’re a retailer yourself, you already know inventory is a major expense, it’s an important retail KPI. You can lower them by reducing the cost of warehouse labor or finding a cheaper place to store goods. Another solution is to achieve better control of your inventory.
Achieving the ideal level of inventory is a challenge, we understand that. If you have too much inventory, carrying costs are going to go up. If you have too little inventory, you lose sales from not having those items available. It’s a double edged sword you have to balance.

Even so, that doesn’t mean you can’t control your inventory better, that doesn’t mean you can’t reduce your cost. We’ve talked about inventory control many times on the blog. You can figure the right amount by utilizing forecasting software or analyzing your past sales records. A great start would be using our POS reporting and EDI 852.

We want to give you a few tips to better control your inventory carrying cost.

  • Identify your reorder point. If your past sales data shows holiday shopping begins in October, there’s no point in ordering all your holiday-related items in March. Why would we do this? We wouldn’t, we’d be paying months of storage cost and expenses.
  • If your supplier is pushing you, we’ll say a minimum $10,000 order and you don’t need that amount, try to negotiate a better deal. All they can tell you is no, right? You might be in a better position paying a premium on a smaller quantity. Even so, you could potentially work with other stores to make a joint order that meets the minimum. Always shop around and keep your opportunities open.
  • Always be careful of “discounts.” A discount offer for a large order may sound like a good idea but it’s not a good deal if those items are just sitting on your shelves. Be smart buying your inventory.
  • If you have items in storage that just aren’t moving, selling them at a big discount or donating them to charity might be a good way to cut your carrying costs. If your expenses are adding up and that product is not going anywhere any time soon, get rid of it!

When you have the right reporting in place and you can make educated based decisions to grow your business, the sky is the limit. You need the right tools in retail to win and Accelerated Analytics has them. If you’re trying to grow sales and you’re not reaching your potential, let’s jump on a quick call. Your competition is focusing on analytics and reporting to grow, you better be too. Get started here.

*Accelerated Analytics publishes resources like this to provide insights to different analytical metrics, data points and formulas. Please be aware, we’re not claiming that our POS reporting services will offer this example or any other metric, data point or formula. To learn exactly what our reporting covers, please feel free to schedule a demo or give us a call. Thanks for understanding.

What Is Days Sales In Inventory (DSI)?

Days Sales Of Inventory

The financial ratio days’ sales in inventory (DSI) tells you the number of days it took a company to turn its inventory, also known as inventory turnover. This ratio would also include goods that are in progress of being sold. Keep in mind that a company’s inventory will change throughout the year, and its sales will fluctuate as well. Therefore, you should view this as an average from the past.

DSI is also referred to by average age of inventory, days inventory outstanding (DIO), days in inventory (DII), days sales in inventory or days inventory and is interpreted in multiple ways. Yeah, takes some time to get use to saying that.

Indicating the liquidity of the inventory, the figure represents how many days a company’s current stock of inventory will last. Generally, a lower DSI is preferred as it indicates a shorter duration to clear off the inventory, though the average DSI varies from one industry to another.

Calculating DSI

DSI = (Average Inventory / COGS) X 365

  • DSI – Days Sales Of Inventory
  • COGS – Cost Of Goods Sold

Now, in order to manufacture a product to sell, the company is going to need raw material and other resources from inventory. As always, there’s always a cost associated to the materials. You’ll also have cost associated to the manufacturing of the product using inventory.

When you include the cost of labor and utilities like electricity or water, this is represented by the cost of goods sold (COGS) and is defined as the cost of acquiring or manufacturing the products that a company sells during a period. DSI is calculated based on the average value of the inventory and cost of goods sold during a given period or as of a particular date.

Mathematically speaking, the number of days in a period are calculated using 365 for a year and 90 for a quarter. It’s important to note that some companies will use 360 days versus 365 days.

The numerator figure represents the valuation of the inventory. The denominator (Cost of Sales / Number of Days) represents the average per day cost being spent by the company for manufacturing a product to sell. The net factor gives the average number of days taken by the company to clear any inventory they have on-hand.

There’s 2 different versions of the DSI formula that can be used depending on how the accounting is done.
In version 1, the average inventory amount is taken as the figure reported at the end of the accounting period, such as at the end of the fiscal year ending June 30. This version represents DSI value “as of” the mentioned date.

Version 1: Average Inventory = Ending Inventory

Version 2: Average Inventory = (Beginning Inventory + Ending Inventory) divided X2

In version 2, the average value of Start Date Inventory and Ending Inventory is taken, and the resulting figure represents DSI value “during” that particular period.

Now, the COGS value for version 1 and 2 will stay the same..

What Can DSI Tell You?

There’s a lot of takeaways that DSI can give you. Since DSI indicates the amount of time a company’s cash is tied up in its inventory, the aim is low DSI values for the company. If a company scores a low DSI, that company frequently selling its inventory, which usually results in higher profits, if sales are being made in profit that is.

On the other side, a large DSI value is going to suggest that a company may be struggling with high-volume inventory, which is never a good thing. It is also possible that the company may be retaining high inventory levels in order to achieve high order fulfillment rates, such as in anticipation of bumper sales during an upcoming holiday season. A great example of this would be Black Friday or Christmas.

DSI can be measure of the effectiveness of inventory management by a company.

Think about it, inventory is usually a big investment of the operational capital requirements for a business. By calculating the number of days that a company holds inventory before it’s sold, this efficiency ratio measures the average length of time that a company’s cash is tied up in inventory.

While DSI is a good indicator in certain scenarios, you have to view it cautiously.  DSI values calculated for brick and mortar retail (Target), online retail (Amazon) and technology (Adobe) sector companies, DSI can vary greatly among industries depending on many factors;

  • Industry Type
  • Product Type
  • Business Model

Due to this, you should be comparing value among their same sector peer companies. Here’s a really good example why. When you look at technology, automobile, and furniture sectors, these companies can hold inventory for long durations. However, if another company is selling eggs, those products have a limit. As you know, eggs go bad, so these companies need to move inventory as quickly as possible.

One must also note that a high DSI value may be preferred at times depending on the market. This is where it gets tricky and you really have to pay attention to the “context” of the scenario versus just the DSI result.

Company A may have inventory it wants to hold onto because they know next quarter, the value for that inventory is going to be worth twice as much. Although they’ll have a higher DSI now, that move is going to lead to higher profits in the next quarter when it’s sold.

Why Is Days Sales Of Inventory Important?

Properly managing your inventory levels is vital for all businesses, even more so for those of you that have retail companies or those selling physical goods. While inventory turnover ratio is one of the best indicators of a company’s efficiency for turning over its inventory and generating sales, the days sales of inventory ratio goes a step further by putting that figure into a daily context and providing a more accurate picture of the company’s inventory management and overall efficiency.

DSI and inventory turnover ratio can help investors to know whether a company can effectively manage its inventory when compared to competitors. For investors, that’s another key metric that gives them insights into the value of a company.

*Accelerated Analytics publishes resources like this to provide insights to different analytical metrics, data points and formulas. Please be aware, we’re not claiming that our POS reporting services will offer this example or any other metric, data point or formula. To learn exactly what our reporting covers, please feel free to schedule a demo or give us a call. Thanks for understanding.
Retail KPIs: Where Should I Focus My Attention?

Retail KPIs

When it comes to the retail industry, there’s a number of retail KPIs you could be tracking. Ultimately, your biggest KPI has to be sales, right? After all, if you’re not making sales, you’re not going to be in business long. Even though sales are a key KPI, there’s a number of different retail metrics you should be tracking.

(1) Inventory Turnover Rate

In simple terms, this measures the rate at which a certain product is sold. Your inventory turnover rate calculated by measuring the costs of the goods sold and dividing that by the cost of the average amount of inventory on hand. For example, if your store sold $200 worth of tape and you have an average of $5 worth of tape on hand, your turnover rate would be 40 times per year.

You already know inventory management is key to every retail business. This KPI allows you to measure how often you should be ordering, optimizing your stock levels and orders of individual products on shelves. In the best scenario, you want similar products to have a similar stock turnover rate. If you have a multiple retail stores in different locations, this KPI can be measured against other stores. Detailed POS reports, like Accelerated Analytics’ reports, do the math for you so you can spend more time focused on the operations of your business.

How it can help: This biggest metric this helps with is identifying ideal par levels on your inventory. Being short-stocked and over-stocked are equally damaging to most businesses, getting it right is vital to your company.

(2) Year-Over-Year Sales

While you should always be focused on sales, year-over-year analytics is one of the more basic, but it’s an essential KPI you must track. Unfortunately, too many small businesses use this KPI alone. It is much more valuable when coupled with another KPI.

You can use year-over-year (YOY) to see numbers if your business is growing, stalling or you’re taking losses. While all that data is helpful, the key is understanding exactly why that happened. There’s a number of questions the data can suggest;

  • Which product(s) caused our YOY growth?
  • What changes took place to influence our YOY decline?
  • What’s changed YOY that has caused our growth to flatline?

This is why companies rely on our POS reports, it allows them insights to all the key retail KPIs so they can make the appropriate decisions at the right time.

How it can help: Year-over-year analysis are great to get a big picture idea of your business’s performance. You can also use other KPIs with your YOY data to analyze other areas affecting performance.

(3) Gross Margin Indicator

Most people think that gross profit is a more important measure of success versus other retail KPIs. While there’s some truth to it, gross profit is dependent on the size of the company. A major retailer’s gross profit might be 100 times greater than that of a local retail store but the boutique could be a much more successful operation.

Gross margin, however, is a more enlightening statistic. This KPI measures gross profit as a percent of gross sales. In other words, it takes the cost of goods sold “COGS” into account.

How it can help: It can be used to determine reasonable markup prices. Adding additional factors into the equation – locations, categories, times – it can also provide more insight into a business’s ideal strategy.

(4) Retail Sell-Through Rate

Your sell-through rate measures the ratio of the number of units sold in a given period and the initial on-hand inventory for the period. It provides the percentage of inventory of a specific product that was sold over a chosen time period.

Divide the total number of a certain item sold by the stock number you had on-hand at the beginning of a given period. Just multiply by 100 to turn the result into a percentage. For instance, if you have 400 items and sell 300, your sell-through rate is 75%. It’s important for you to decide a useful time frame to use when measuring this – this will vary between different business types.

How it can help: This retail KPI is key for seasonal ordering and marketing. It’s important to order accurately throughout the year and fluctuating sales can make this challenge. So, like most KPIs, it’s helpful to have a substantial history you can analyze to make appropriate decisions.

(5) Sales Per Square Foot

Some retail KPIs give you a perspective on the performance of your store layout, one being sales per square foot. First, this determines how efficient your precious space is being used. It’s essential to measure this before and after a retail redesign.

It also is an indicator of staff performance. If you have designated sections of your store and notice large discrepancies between various areas, it might be indicative of poor/great staff performance.

Larger retailers also compare this measurement across multiple locations in an attempt to identify any cultural or social differences that could impact sales. Your POS makes this process a lot easier, if you have the right solution in place.

How it can help: This can be a great indicator of store performance: retail layout/design, staff productivity, and multi-location sales/analysis.

(6) Customer Conversion Rates

Another common KPI for retailers is customer conversion rates. This measure is taken by dividing the total number of transactions by the total number of customers in your retail store. It can also help you determine the success of some in-store components of your business, such as;

  • Store layout
  • Store experience
  • Customer service

If you’re having trouble getting foot traffic to your store, improving your conversions is going to be a key KPI to focus on. It’s one of the most important retail KPIs you have and should be evaluated regularly.

Conversions rates also play a key role for those of you that have ecommerce stores in addition to brick and mortar retail store.

How it can help: Measuring conversion rates and identifying trends is 2 key factors for determining if you’re offering products that your customers want. This KPI gets at the very heart of what your goals should be as a retailer.

(7) Gross Margin Return on Investment

GMROI, gross margin return on investment, tells you how much your profit was based on the amount spent on inventory.

For example, if you sold $200,000 in product and your inventory cost was $100,000, your GMROI would be 2 (which means you’re earning $2 for every $1 invested in inventory). This KPI obtains information on both individual products and inventory as a whole.

When you get good at GMROI, it becomes easy to determine which products to promote and where to place them in your retail space.

How it can help: There are industry standards for GMROI, so this is simple and tangible way of hitting benchmarks. Look up what an optimal GMROI is for your retail niche and let it optimize your inventory and ordering.

Your POS Report Can Help With Your Retail KPIs

Advanced POS reporting, like Accelerated Analytics provides clients, helps retailers analyze important data, like these KPIs and many others. Through customer databases, detailed inventory tracking, smart reporting and more, your point of sale reporting solution must be much more than just numbers.

*Accelerated Analytics publishes resources like this to provide insights to different analytical metrics, data points and formulas. Please be aware, we’re not claiming that our POS reporting will offer this example or any other metric, data point or formula. To learn exactly what our reporting covers, please feel free to schedule a demo or give us a call. Thanks for understanding.
Retail POS: What Features Do I Need From Our Retail POS System?

Retail POS

The retail industry has been experiencing a big power shift over the last decade, from the retail side to customers. If your retail business is not customer centric in 2019, you could find yourself struggling. How do you gain that advantage in your retail business? POS of course.

Think about it, how easy is it now for customers to leave reviews, leave ratings and share personal experiences via social media? More than any other time in history, shoppers are more informed and selective.

What does that mean for your retail business? You have to adapt to these changes. Having the right retail POS system and the right POS data make a huge difference in selling your products. You always want to know what your retail metrics are, POS data and reporting gives us the tools we need.

Choosing a POS system for your business is a big decision. Choosing a POS reporting partner is equally important. With both in hand, it’s going to give you insights into the behavior of your customers.

POS Features

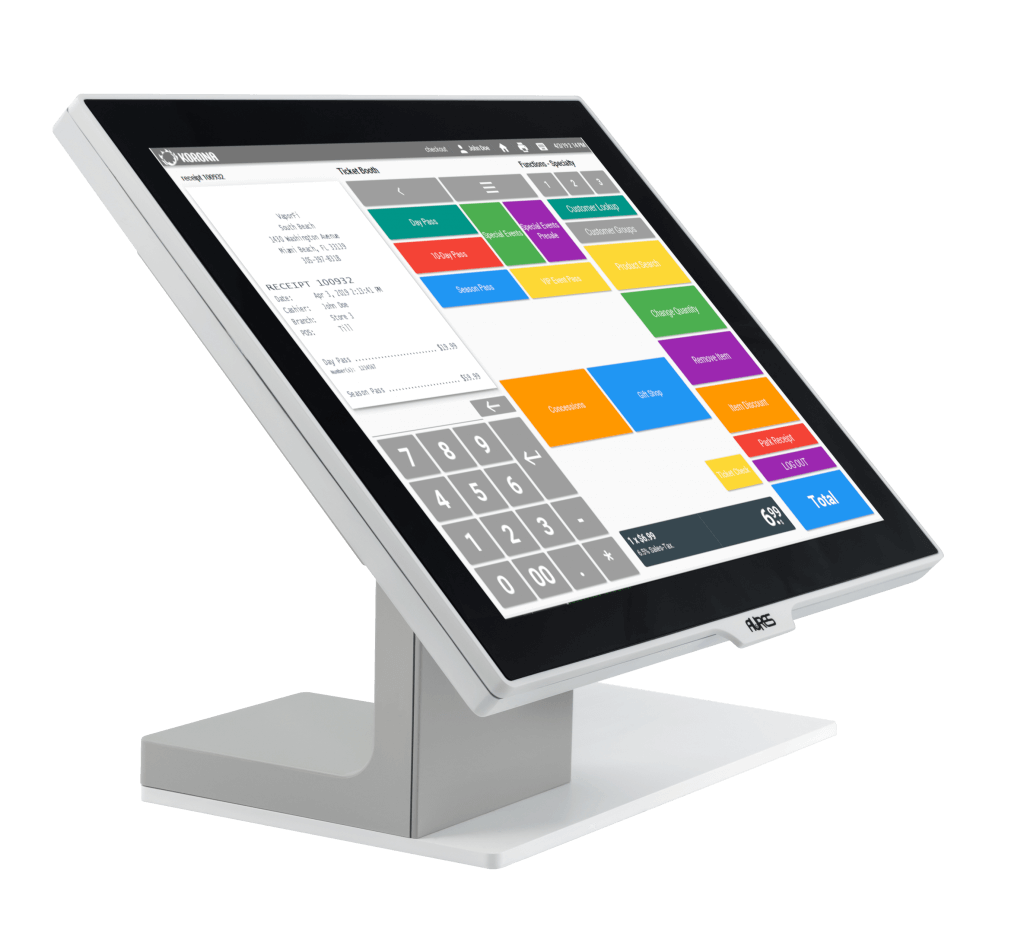
Now, a POS system is really a retail management system as the software often goes much deeper than just processing sales. In fact, POS systems can do a lot, so you want to look for a POS that offers;

  • Inventory Management
  • Customer Management
  • Employee Management
  • Membership Management
  • Bookkeeping
  • Sales Reporting
  • Purchase Orders
  • Stock Transfers
  • And much, much more

They allow you to control your inventory, allow you to see how your inventory is moving while also showing you product sales from each one of your locations. You can also track employee performance and hours with a POS.

Some POS system solutions have extended features that can integrate with your CRM, accounting, ecommerce and shopping cart software. POS systems have come a long way over the last decade and one that is packed with features like these can be extremely beneficial for your retail company.

Now, a POS system is usually designed for a specific industry. While some retail POS systems may also be used for restaurants, most will be niche specific. You’ll see POS systems designed for bars, cafes, hotels or finances.

For retail POS, you’ll usually see them have capabilities that include;

  • Omnichannel Selling
  • Product Variants
  • Payment Processing
  • Ecommerce Integrations
  • Multiple Stores And Locations
  • Cloud Technology

Should I Get A Retail POS System?

If you ask us, the answer is a big “YES!” The POS environment has drastically changed over the last few years. We remember when POS systems were huge investments and while they’re not cheap per say, they’re very affordable.

Secondly, the features and capabilities have greatly increased, many we’ve already listed above. Most POS systems now connect with the cloud and the software/tools you use will likely integrate with a number of different retail POS systems.

Third, think about all the benefits you will gain having a POS system and POS reporting to boot. Askuity did a POS data study last year and found out 63 percent of brands are leaving Excel for POS solutions. The big question, why are they leaving? The answer is to leverage the POS reports and analytics of course. If you ask some of the companies that use our POS data and reporting, they would tell you first hand it has a big impact on their bottom line and impacts their decision making.

Additional studies are showing that smartphones will account for nearly 33 percent of retail sales in 2019, that’s well over a $1 trillion in purchases.

There’s a number of different retail POS systems on the market. You know what your retail business needs, make sure you find the exact features you’re looking for. Before you choose a POS System for your business, make sure you do your due diligence.

Once you have your retail POS, you can come back to Accelerated Analytics to get the best POS reporting in the business.

Inventory Turnover Ratio Formula

Inventory Turnover

The inventory turnover ratio is an efficiency ratio that shows you how effectively inventory is being managed by comparing cost of goods sold with average inventory for a period. This metric measures the amount of times average inventory is “turned” or sold during a period. In short, it measures how many times a company sold its total average inventory dollar amount during the year.

Quick Example: A company with $1,000 of average inventory and sales of $20,000 effectively sold it at 20 times over.

Why is your inventory turnover ratio important? Well, it’s a performance indicator that focuses on 2 core components.

  • Purchasing Stock
  • Sales

Purchasing Stock: If large amounts of inventory are purchased during the year, the company must sell greater amounts of inventory to improve turnover. If the company can’t sell these greater amounts of inventory, turnover will be negative. This will lead to more storage costs and holding costs, both you want to avoid.

Sales: You want your sales to match inventory purchases. If you can’t match it, inventory will not turn effectively. This is exactly why your purchasing and sales departments have to work in conjunction.

Inventory Turnover Ratio Formula

The inventory turnover ratio is calculated by dividing the cost of goods sold for a period by the average inventory for that period.

Inventory Turnover Ratio = Cost Of Goods Sold ÷ Average Inventory

You may be wondering why we use average inventory versus ending inventory.

We use average inventory versus ending inventory because most companies’ have merchandise that fluctuates throughout the year. For example, some companies may purchase large amounts of merchandise at the beginning of the year and they sell it throughout the year. By the time December rolls around, all of the purchased inventory is sold. In this scenario, the ending balance does not accurately reflect the company’s actual inventory during the year.

Finding your average inventory is an easy formula. Average inventory is usually calculated by adding the beginning and ending inventory and dividing it by 2.

The cost of goods sold is reported on the income statement.

An Important Retail Metric To Many

Now, since inventory turnover measures how efficiently a company can control its merchandise, it’s vital to have “high turn.” This would indicate that the company doesn’t overspend buying its inventory or wastes resources by storing non-salable inventory. It would also show that the company can effectively sell what inventory it buys.

There’s another big factor that this measurement shows, that is how liquid a company’s inventory is. If you’re looking for investors, they’ll want to see that retail metric.

Inventory is one of the biggest assets a retailer reports on a balance sheet. If this inventory can’t be sold, the inventory is worthless to that company. This measurement shows how easily a company can turn its inventory into cash, which is important for an investor thinking about investing in your business.

This metric is also important to creditors. Creditors are usually interested in this because inventory can be put up as collateral for loans. Banks want to know that this inventory will be easy to sell for cash.

Now, inventory turns vary from one industry to the next. For example, the apparel industry has one of the highest turn averages among all industries.

Inventory Turnover Ratio Example

Mel’s Furniture Company sells home furniture in California. During the current year, Mel reported cost of goods sold on its income statement of $1,000,000. Mel’s beginning inventory was $4,000,000 and its ending inventory was $5,000,000. Mel’s turnover is calculated like this:

.22 Times = $1,000,000 ÷ ($4,000,000 + $5,000,000) / 2

If this was a real example, this would show that Mel has bad inventory turnover. It means Mel sold less than 1/3 of his inventory for the year.

*Accelerated Analytics publishes resources like this to provide insights to different analytical metrics, data points and formulas. Please be aware, we’re not claiming that our POS reporting will offer this example or any other metric, data point or formula. To learn exactly what our reporting covers, please feel free to schedule a demo or give us a call. Thanks for understanding.
Retail Forecasting: Why It’s Vital To Your Growth

retail forecasting

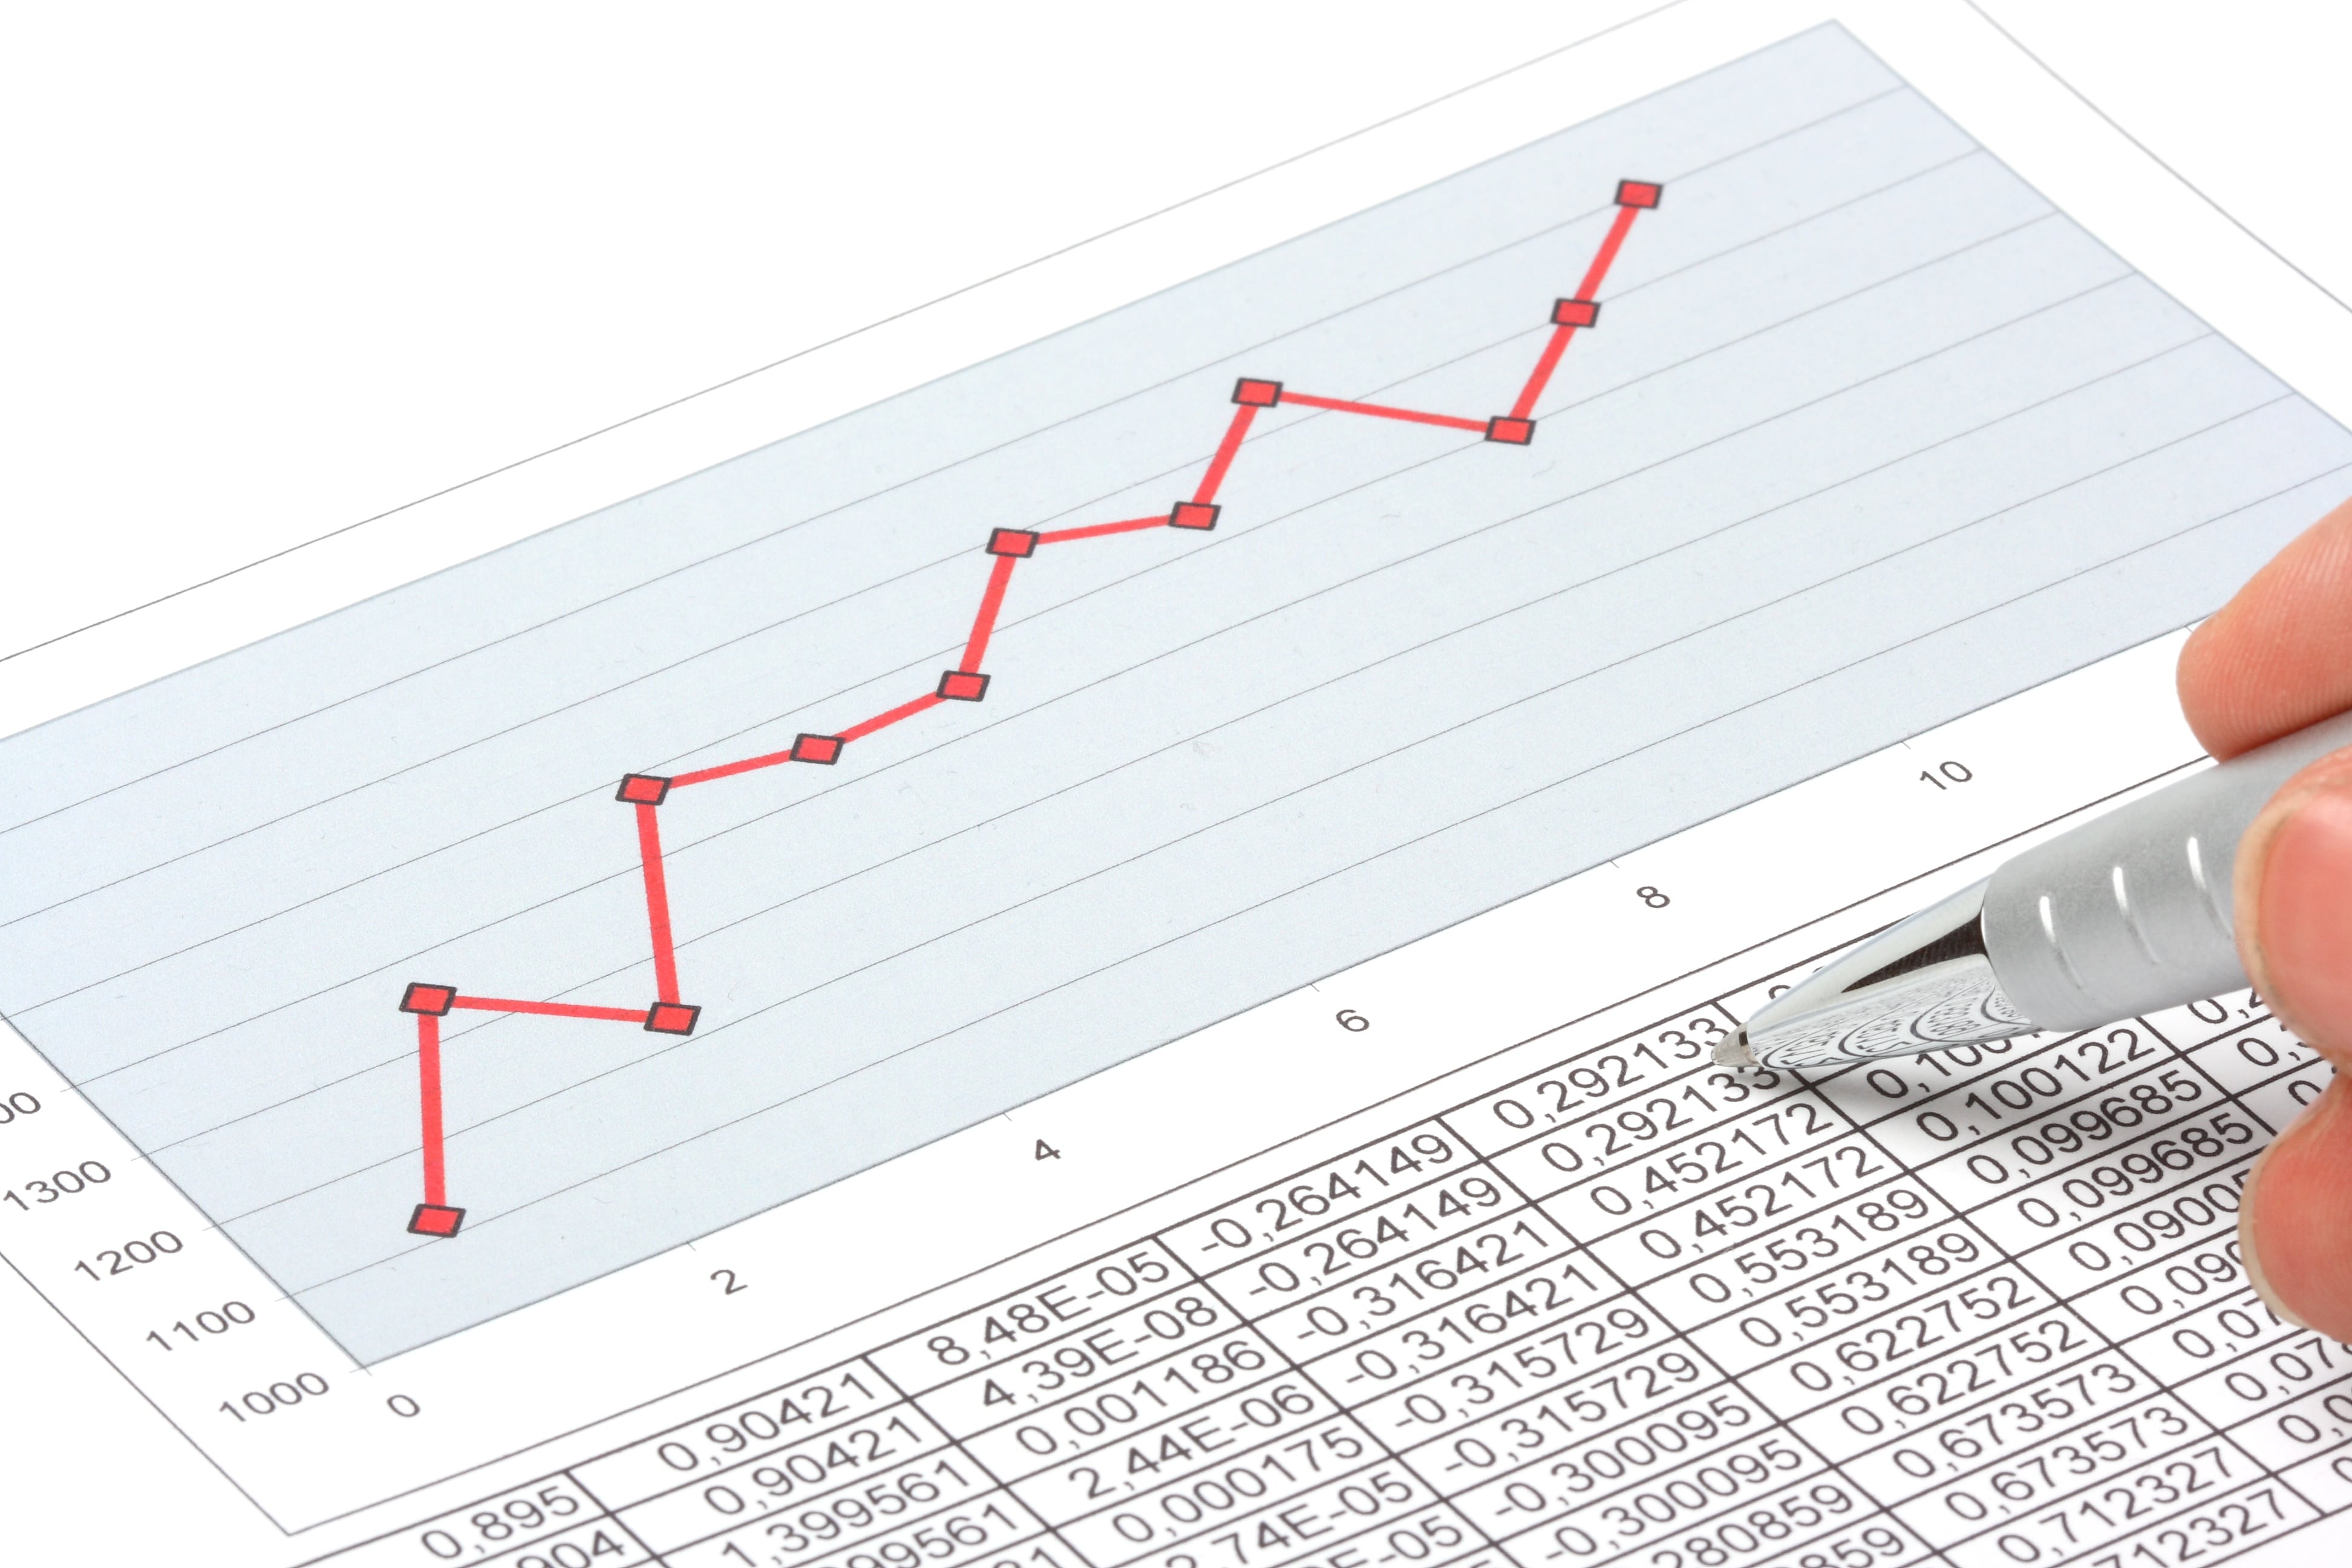
Retail forecasting can be tricky if you don’t know how to do forecasting or you don’t have the technology to track your retail data. Fortunately, we have some amazing software and tools to help you accurately track your POS data. With POS data on hand, you’ll be able to create retail forecast for your business.

Business owners and managers make use of this data to optimize retail delivery of products to their customers. Forecasting in retail involves utilizing collected data to predict future events and consumer behavior. While the data and market research can vary by the types of products a retailer sells, retail forecasting methods and formulas are the same no matter what type of product you’re selling.

Retail forecasting methods allow you to anticipate future buying actions of your customers by evaluating your past revenue and consumer behavior. We do this by analyzing the previous months data (Month Over Month) or years (Year Over Year) to find patterns and develop forecasts for the appropriate upcoming periods.

For seasonal trends, data is adjusted accordingly and a plan for ordering and stocking products would likely follow such an analysis. Once all orders are fulfilled,  an assessment of the results is compared with previous forecasts, the process is repeated over and over again.

Why Use Retail Forecasting?

In retail management, forecasting serves to predict and meet the demands of consumers in retail establishments while controlling pricing and inventory. You already know how vital inventory management is to your company. What happens when we have too much inventory on hand? We have overhead cost and you already know this too, that cost can add up fast! Holding excess inventory adds to overhead costs for your business, this is why we rely on forecasting so we can avoid that exact scenario.

When forecasting helps the retailer to meet the demands of the customer by understanding consumer purchase patterns better, it allows you to be more efficient using your display shelves, as well as using your inventory space. If you’re outsourcing fulfillment or using a warehouse, you may not have that problem. However, if you have retail space and store your inventory on-site, forecasting can help you keep your inventory at optimal levels.

Retail Forecast Methods

When you’re creating retail forecasts, analysts will consider a number of different factors, such as the product price, marketing and promotions to develop and plan for projected consumer reactions at the point of sale.

There’s a number of different methods for identifying and understanding past trends in retail sales, these involve incorporating economic indicators into your data. What would that refer too?

  • Available disposable income
  • Unemployment rates
  • The rate of inflation
  • Levels of household debt
  • Value of all goods and services

In addition, current, recent and projected near-future activity in the stock market is taken into consideration to gauge consumer confidence in the economy.

Benefits Of Forecasting

There’s a number of positive benefits that retail forecasting gives your company.

  • Long-Term Profits – Accurate retail forecasts can help retail business owners and management to maximize profits over the long term.
  • Price Adjustments – Forecasting allows you to make price adjustments to correspond with the current level of consumer spending patterns.
  • Inventory Management – Maintaining and controlling a sufficient but moderate inventory that meets the need without being excessive also adds to long-term profits in the retail industry.
  • Future Demand – Retail forecasting can help you predict rises in demand and trends.
  • Marketing – There’s many ways you can use your past data to benefit the marketing and promotions you’re running now.

In retail, there’s always a lot of moving pieces. Forecast can help you see the future, it can help you make better decisions and it can drive the growth of your company. If you’re not using your POS data and retail data to make better informed decisions, it’s never too late to start.

*Accelerated Analytics publishes resources like this to provide insights to different analytical metrics, data points and formulas. Please be aware, we’re not claiming that our POS reporting will offer this example or any other metric, data point or formula. To learn exactly what our reporting covers, please feel free to schedule a demo or give us a call. Thanks for understanding.
What Is Product Distribution?

Product Distribution

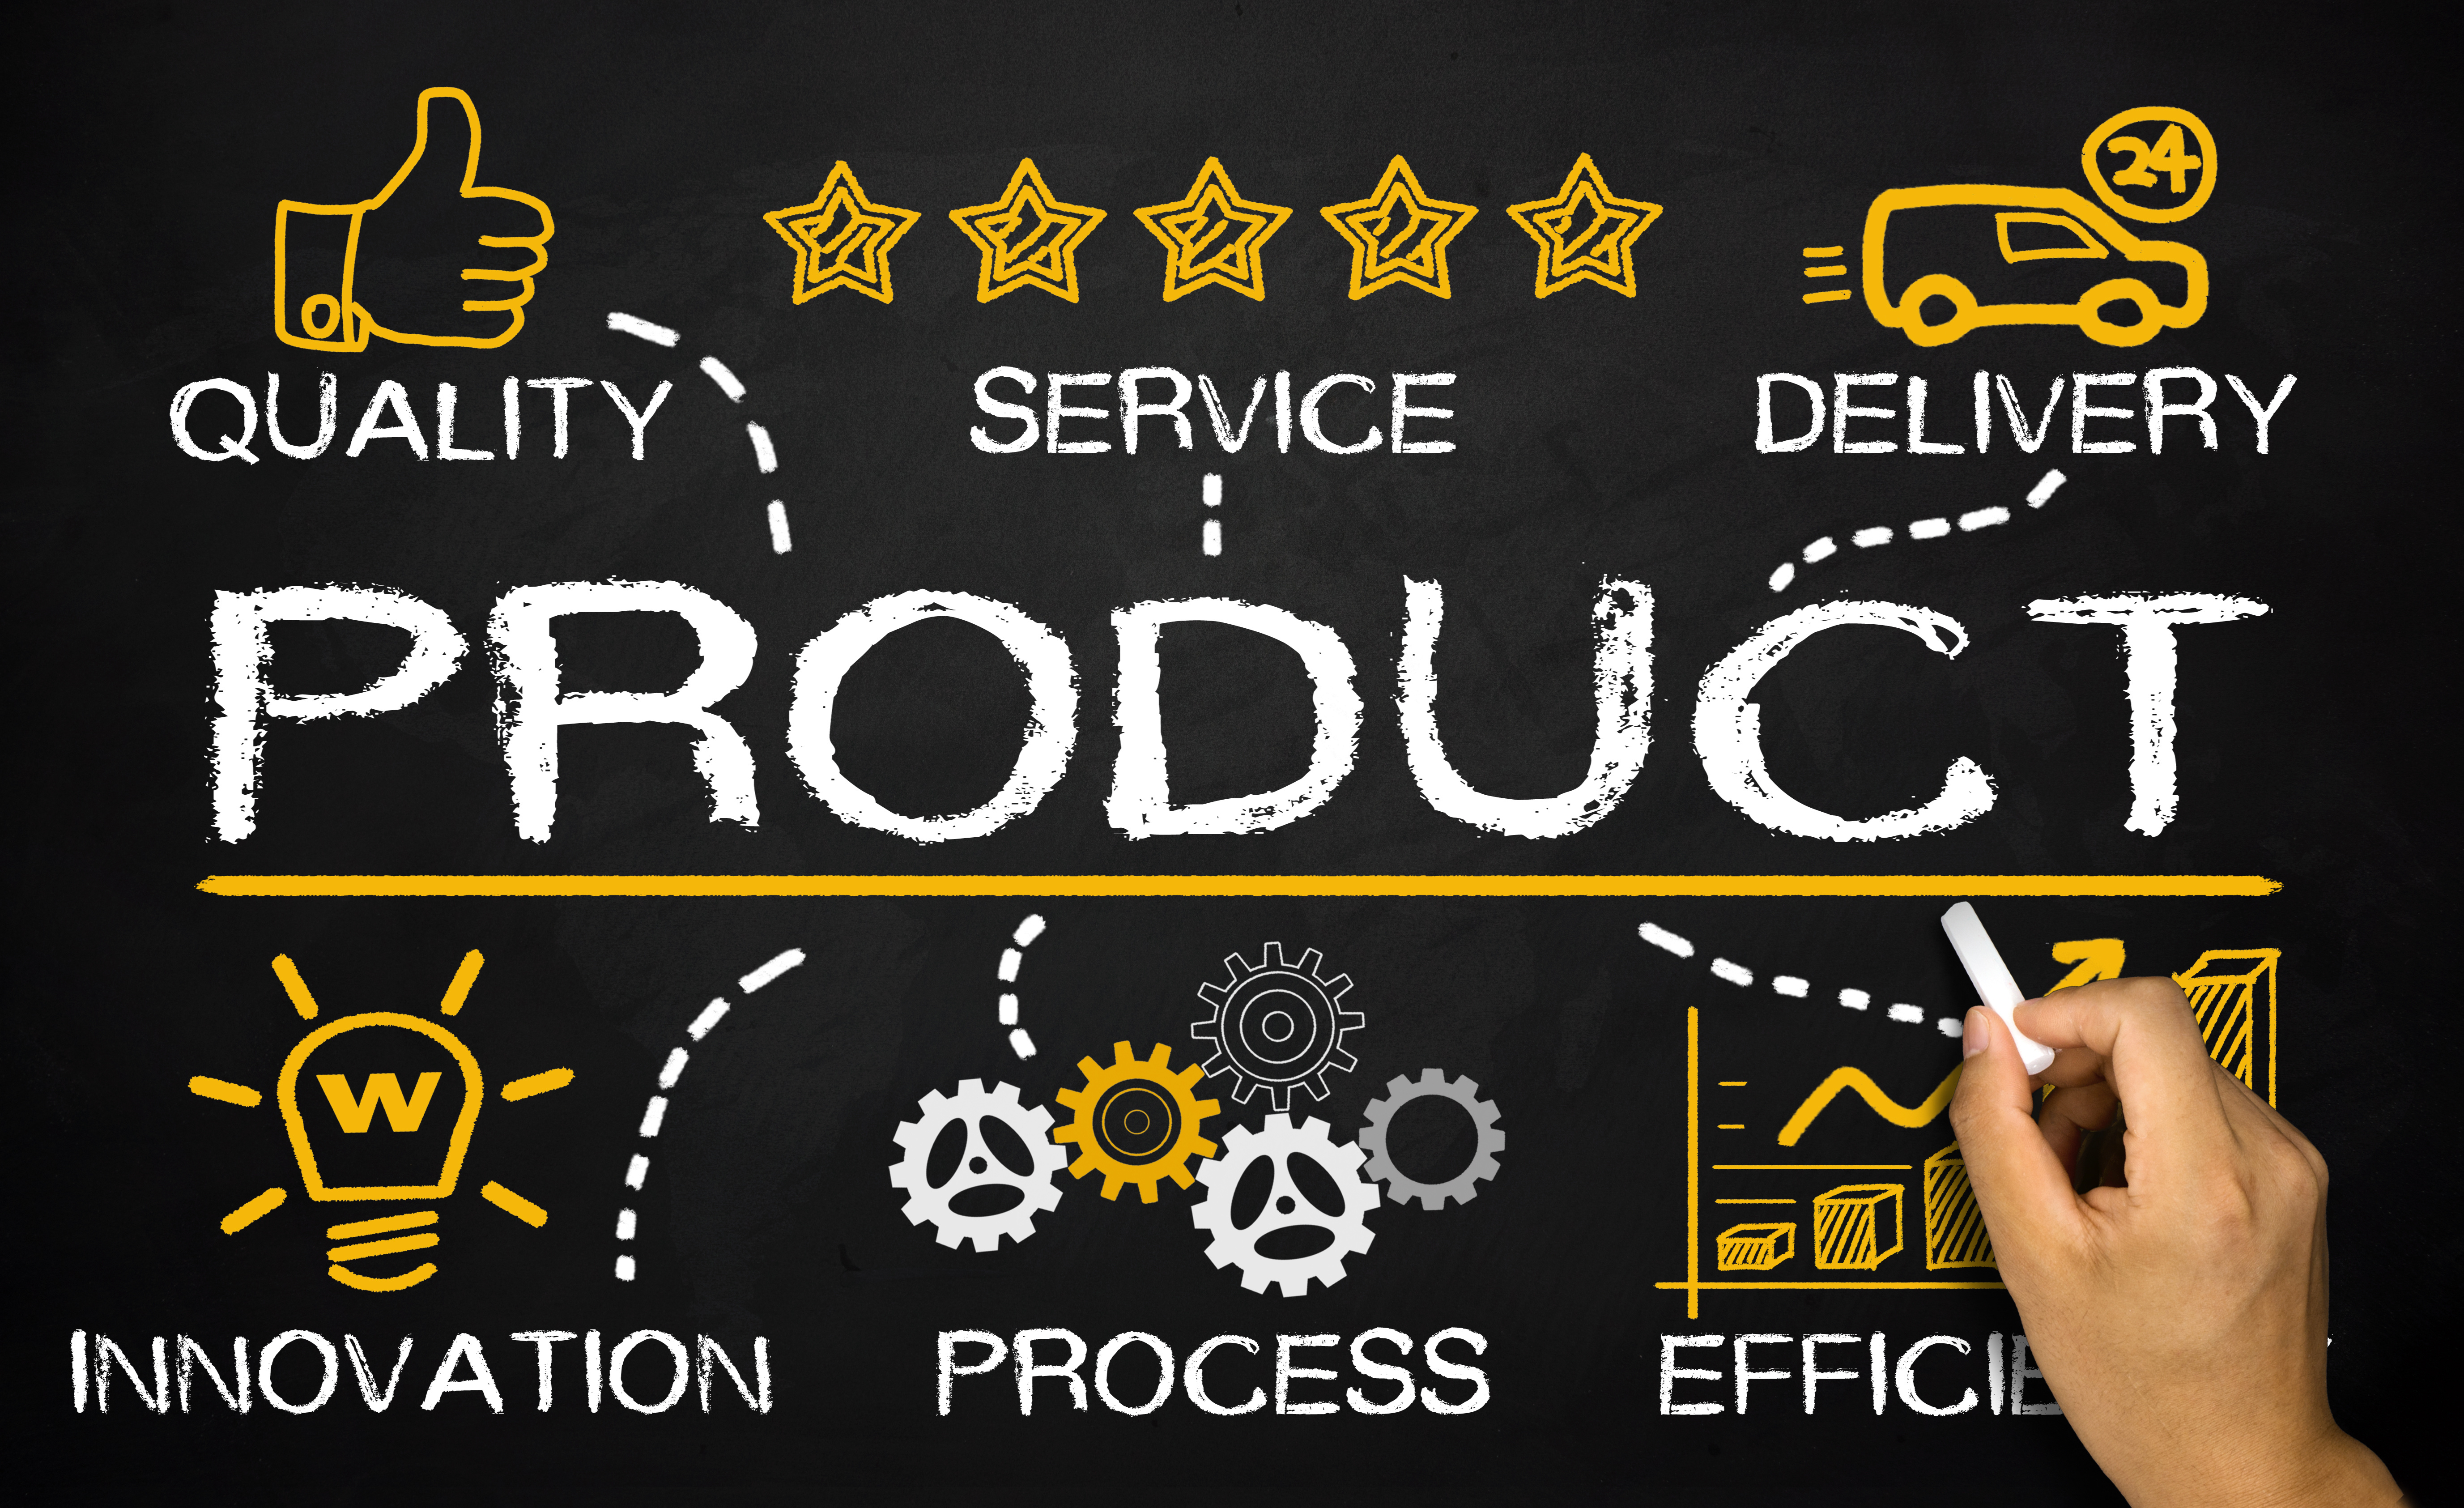
Distribution refers to the process of selling and delivering products or services from manufacturer to customer. As companies grow, it becomes vital to improve your distribution to ensure that everyone in your distribution channel is happy. Depending on the network of your distribution channel, there can be many people and strategies involved in a company’s product distribution.

Why Is Product Distribution Important?

Product distribution plays a vital role in a company’s operations. You want to have the ability to analyze and improve relationships between manufacturers and customers. If there’s no way to do this, you won’t improve. When you run into bottlenecks in your distribution, a lot of bad things can happen. When deliveries start to fall short, customers, retailers and your suppliers won’t be happy. If you want your product distribution to be successful, you want a feedback loop that allows you to make continuous improvements.

As it pertains to customers buying products online, there’s a level of trust customers give you when they buy a product they can’t physically see and touch. For merchants, this is where accurate pictures and descriptions are extremely important.

3 Types Of Product Distribution

The type of distribution strategy you use will depend on the product you’re selling.

  • Intensive Distribution
  • Selective Distribution
  • Exclusive Distribution

Now that you know what those 3 product distribution strategies are, let’s break them down to see how they’re unique and differ.

  1. Intensive Distribution: This strategy targets as many channels and outlets as possible. The goal of intensive distribution is to penetrate as much of the market as possible. You want to be everywhere you can.
  2. Selective Distribution: This strategy is selective, only focusing on specific channels and outlets. There’s going to be specific locations you want to be at with this method. This is often based on a particular good and its fit within a store. Doing this allows manufacturers to pick a price point that targets a specific market of consumer, therefore providing a more customized shopping experience for customers. Selective distribution caps the number of locations in a particular area.
  3. Exclusive Distribution: This strategy focuses on limiting the channels and outlets you use. Very selective. The first example for this particular method is luxury brands, perhaps a special collection of some type where it’s only available at specific locations or stores.  This method helps maintain a brand’s image and product exclusivity. Some examples of companies that use exclusive distribution would be high-end designers like Chanel or even an automotive company like Ferrari.

Distributor Profiles

There’s 4 core profiles in distribution.

  1. Distributors
  2. Wholesalers
  3. Retailers
  4. Brokers And Agents

We’re going to be comparing distributors and wholesalers as they play the main key roles in distribution.

How Do Distributors And Wholesalers Differ?

When it comes to the difference between a distributor and a wholesaler, many things are often confused between one another. Despite the two having things in common, the two greatly differ also. Distributors work closely with manufacturers to aim at selling more goods and gaining better visibility on those goods. It’s not uncommon for distributors to reach out to wholesalers so they can resale their products. Wholesalers work closely with retailers, they buy products in bulk due to the discounts they get from retailers. It is distribution that plays a key role in your distribution channel because it plays as a medium between manufacturers and their customers.

Distribution And Dropshipping

Every company wants to operate a product distribution channel that benefits everyone. With ecommerce and dropshipping, it’s no different. Manufacturers, suppliers and distributors can leverage the online marketplace to promote their products. Merchants can then leverage these online channels to choose the products they want to sell as seen fit. When customers purchase products from online stores, merchants are notified and orders are placed with the distributor who arranges for shipment from their facilities. Merchants heavily rely on their distribution partners as everything but selling is out of their control.

What Is Distribution Management?

Distribution management refers to the resources and processes that are used to deliver a product from a specific location to the point-of-sale, which includes storage at warehouses, retail distribution points, shipping and delivery and others.

  • Warehousing – This would refer to where you choose to house products.
  • Packaging – You always want to make sure your packaging is efficient so products can be safety shipped.
  • Inventory Management – Proper inventory management is key to distribution. Managing your inventory is one of the core pillars in distribution management. We’re always talking about ways to optimize inventory, like inventory control and (EIF) ending inventory formula.
  • Order Processing – When a customer places an order, distribution management needs to plan for the delivery of that item. This involves collecting the stock, loading it and delivering it in a timely manner. Approval needs to be sent and invoicing done for this step to be valid.
  • Logistics – You always have to think about how products are going to be shipped. What type of transport and shipping you’re going to use is important to your bottom line. If they require overseas shipping there must be agreements in place for permits to be approved quickly.
  • Communication – Clear communication along the entire distribution channel is always vital to success. You want to make sure you have such processes in place. This is to ensure that the correct products are shipped and customers know when they will receive their items.

What Is E-Distribution?

You don’t hear the term “E-distribution” a lot but it refers to the distribution of things like software and digital downloads.

There’s a numbers of different categories that E-distribution plays a role in, such as video games, computer software, marketing tools, online advertising, movies, music, e-courses and digital ebooks. Since it’s easy to create multiple products or subscriptions,  this industry is quickly growing and super profitable. While it differs from physical distribution, e-distribution has to be immediate for it to be successful.

When customers buy a digital product, they expect to receive that product immediately through a download link or given digital access to the product. If you buy a digital product and don’t receive it, the excitement quickly fades and you’re going to reach out to the supplier. In the background, there’s a lot of systems running to ensure digital products are delivered correctly.

The upside in this industry is limit less as there’s very little negative factors for delivering these types of products and services.

What Is Marketing Distribution?

As slightly different from e-distribution and supply chain distribution, marketing distribution is how the marketing department makes products and services available to potential prospects and customers. Availability can be through the manufacturer, supplier, distributor, retailer, or wholesaler. From the perspective of the 4P’s of the marketing mix, marketing distribution can be slotted into the place category. Examples of marketing distribution channels include:

  • A distributor can be employed by a manufacturer to reach out to suppliers or retailers to purchase their product,
  • A supplier can make their stock available on a marketplace for merchants to find and sell,
  • A retailer could stock a wide array of products strategically placed across their store to entice customers to buy,
  • A wholesaler can build a website so customers can order products straight from them.

*Accelerated Analytics publishes resources like this to provide insights to different analytical metrics, data points and formulas. Please be aware, we’re not claiming that our POS reporting services will offer this example or any other metric, data point or formula. Thanks for understanding.

What Is Safety Stock?

Safety Stock

Safety stock is a retail term used to refer to an additional quantity of items help by a company in inventory to reduce the risk of being out of stock. In a perfect world, we would never run out of stock. Unfortunately, it’s not a perfect world and at some point, it can happen to you. To reduce the risk of stock out, companies maintain safety stock.

Safety stock acts like a buffer just in case demand rises for a product or if a supplier is unable to deliver additional products for a longer duration than normal. Retailers would keep additional products on hand while manufacturers would keep a safety stock of materials to minimize the risk of production interruptions.

Now, if it’s that easy to avoid out of stocks, why doesn’t every company use safety stock? Ultimately, it’s due to cost as safety stock can be very expensive. On top of that, you have holding cost or carry cost you have to deal with. While holding and carry cost can be expensive, lost sales may be more expensive, so it’s a delicate balance that companies must control on a regular basis.

Things Can Change Quickly, Even Instantly

An unpredictable surge in your product’s popularity can leave your supplier unable to match the level of demand, at the least it may take a long time to replenishing your inventory. Things can breakdown in production, you may need machinery repaired that can put you down for days. Severe weather, from snowstorms or hurricanes (or other weather related troubles affecting your stock) can strike with very little warning,  the unexpected can happen. Having safety stock in place is one way we can be prepared for the unexpected.

As it pertains to your supply chain, problems are going to happen, but what’s the best way to handle these types of incidents when they happen? It’s not like you can just stop selling until everything is back to normal. There’s no way you can do that, so what’s the right answer?

I’m sure many of you reading this would likely ask, “what about backordering?” Now, backordering could work but there’s risk associated to it, like missing sales and bad customer loyalty. There has to be a better way, right?

There is… it’s called safety stock. Safety stock is like a small emergency warchest you can break out when the going gets tough and it looks like you’re on the verge of selling out. You’d want to have enough in it to help you weather the storms when they roll around, but not so much that the carrying costs end up straining your finances. While this sounds like common sense, the trick is to decide on how much safety stock to carry.

There’s the temptation to stock enough to last you until a fresh shipment (or two) comes through, but always remember that the more you stock, the higher your carrying costs become. Just think about it; whatever you sell doesn’t just have to cover its own carrying costs – it has to cover the carrying costs of the safety stock as well.

How To Calculate Safety Stock?

1. Multiply your maximum daily usage by your maximum lead time in days.
2. Multiply your averare daily usage by your average lead time in days.
3. Calculate the difference between the two to determine your Safety Stock.

Safety Stock = (Maximum Daily Usage x Maximum Lead Time In Days) – (Average Daily Usage x Average Lead Time In Days)

It may take a second to do the calculations but it’s simple. All you need to start is your purchase and sales orders history.

As usual, we’ll give you an example.

There is a business based in the United States (Doug’s Gold Coins) and they’re selling graded gold coins in Canada. On an average, it takes about 48 (average lead time in days) days to get the graded coins from Canada to the United States. Doug’s Gold Coins sell about 15 coins a day (average daily usage), and on weekends and bank holidays, they can sell as many as 18 (maximum daily usage). Unfortunately, in Canada they have bad snow storms, this results in longer lead times, up to 60 days (maximum lead time in days).

So for Doug’s Gold Coins, their safety stock levels would be:

(18 x 60) – (15 x 48) = 360

This means Doug’s Gold Coins would need to have about 360 units of safety stock on hand at any time (especially during the fall and winter when snow storms are common). With 360 units in their safety stock stockpile, selling about 90 gold coins a week (15 per day on weekdays and 18 per day on weekends), Doug’s Gold Coins will have enough stock to last just over three and half weeks.

Your safety stock is there to protect you against all the fluctuations in demand and lead time, buffering you against all unexpected occurrences. From a surprise spike in demand to a boom in popularity or delays caused by the weather, your safety stock is there to get you through any trials and tribulations you should face.

While it varies on exactly what you’re selling or manufacturing, you always need to pay attention to the different seasons. If you’re like Doug’s Gold Coins, you may see a spike in demand around the holiday season. Doug’s gold coins tend to fly off the shelves come December as they make great Christmas presents, tripling demand. So for December, Doug’s Gold Coins would need to make sure there’s enough safety stock just in case demand doubles or higher.

Now, once the peak of the season has passed, you’ll need to start reducing your safety stock levels. Remember: more safety stock = higher carrying costs. After the holiday season has passed, there’s going to be a lot less people shopping, which equals less opportunities to sell your products.

Stock Levels And Reorder Point

Now, you just learned how to calculate your safety stock and what levels will your reorder points.

When it’s time to decide your reordering quantity, you shouldn’t keep your safety stock locked up. Instead, it should be a quantity that exists in your order management software, especially since it’s a vital part of reorder point calculations.

*Accelerated Analytics publishes resources like this to provide insights to different analytical metrics, data points and formulas. Please be aware, we’re not claiming that our POS reporting services will offer this example or any other metric, data point or formula. To learn exactly what our reporting covers, please feel free to schedule a demo or give us a call. Thanks for understanding.