Author: Chad Symens

Reorder Point Formula: How To Calculate ROF

reorder point formula

Reordering products are easy, right? Well, not so fast. When it comes to determining reorder points, there’s a lot you have to consider. This is why many retailers use a reorder point formula. If you don’t know what a reorder point formula (ROF) is, it’s defined by a specific time for you to order new product.

Your reorder point is another super important retail metric you need to know.

How To Calculate Reorder Point?

  • Calculate your lead time demand in days.
  • Calculate your safety stock in days.
  • Sum your lead time demand and your safety stock to determine your Reorder Point.

Now, to understand the math behind our reorder point calculator, let’s break this formula down.

You’ll have to know your lead time demand in order to get your reorder point. This refers to how long you’ll have to wait before new stock arrives. Ideally, you want to have enough in stock to satisfy customer demand until new stock arrives.

And you’ll need to know your safety stock, because that’ll protect you against any unexpected occurrences. Add your lead time demand to your safety stock… and voila! Once your stock levels hit the total, it’s time to place a new order to replenish your supply.

Lead Time Demand – (Cause Shipping Is Never Immediate)

It’s going to take time for new stock to arrive. While it would be great to get new stock instantly and one day we may see just that, stock takes time to arrive.

Even if you have products in stock, it can take your supplier time to pack your order and get it shipped over to you. This waiting time is referred to as “lead time.” As usual, we want to give you an example so you truly understand it.

Company A is located in the U.S. and they sell bracelets that are manufactured in Indonesia. We’re going to assume Company A is always stocked and the warehouse has bracelets already on hand. At the very least, it’s going to take a few days to pick and pack the bracelets. Once they’re picked and packed, it takes another 4 days to get to the port by truck. From there, it will take 21 days to travel from Indonesia to the U.S. From there, they could spend up to a week in customs and will take another 3 days to travel to a Company A warehouse.

Safety Stock – (Protection For The Unexpected)

While it’s awesome when everything runs smooth, things are going to happen and you have to expect the unexpected.

This can take the form of a sudden surge in demand after some unexpected celebrity endorsement, and now your product is selling fast. Or perhaps your supplier’s factory has experienced a breakdown and it’ll take a week for them to replace the damaged component and get their machine up and running again.

And here’s where safety stock comes in. Safety stock is buffer stock you carry as a last defense against unpredictable events that either deplete your stock (surge in demand), or unexpected manufacturing time (your lead time skyrockets because the supply chain breaks down). Of course you’d like to have enough safety stock to bring the likelihood of going out of stock down to zero, but most of the time that’s not financially viable. After all, safety stock IS for a rainy day that may never come! So how do we decide then on how much stock to keep on standby?

Here’s a simple formula that you can calculate based off your purchase and sales orders history:

Safety Stock = (Max Daily Usage X Max Lead Time In Days) – (Average Daily Usage X Average Lead Time In Days)

Let’s continue the story of Company A. On an average day, they sell 12 bracelets. But during weekends, they can sell as many as 17. As for lead times, their usual lead time is 41 days, but during typhoon season (yes, in Indonesia, they have typhoons) , it can go up to as high as 51 days.

(17 x 51) – (12 x 41) = 375

This means Company A needs to have about 375 units of safety stock on hand to guard against the unexpected (especially during typhoon season). Therefore, with 340 units in safety stock, selling nearly 80 bracelets on a good week (12 per day on weekdays and 17 on weekends), Company A will have enough stock to last a little over 4 weeks.

Your safety stock is a buffer for all the variations in demand and lead time you could potentially face, giving you enough stock on hand to weather unexpected occurrences. Everyone and their entire family wants your products? It’s time to sell your safety stock. Supplier needs an extra week because he’s caught in the middle of a typhoon? It’s time to sell your safety stock.

For those of you that have seasonal products, like Halloween costumes, you have to adjust your safety stock level to ready for your peak season demand. Once the peak season is over, you’ll want to begin reducing your safety stock levels, as more safety stock = higher carrying costs. After all, people are a lot less likely to be buying a new Halloween costume in the spring versus the month of October.

The Reorder Point Formula

Reorder Point = Lead Time Demand + Safety Stock

To complete the story of Company A, their reorder point formula would be:

470 (Lead time demand) + 375 (safety stock) = 845

So once their stock hits 845 bracelets, Company A will need to place a new order with their supplier. At 845 bracelets, they’ll have enough to last them as they wait for new stock to arrive (470), while holding enough stock (375) as a buffer against an unexpected surge in demand or supply chain problems.

Planning reorder points are a crucial part of inventory management. Setting your reorder point to the optimum amount lets you cut down on excess spending, while ensuring you’ll have enough stock for your customers even when things take an unexpected turn.

But how can you always ensure you’ll be able to place a fresh order whenever inventory levels hit the reorder point? Keeping tabs on how much you’ve sold every day is easy when you’re starting out with a single store. But as you start selling more and more, across different channels, manually recording every sale becomes a pretty exhausting chore. And if you only tally up your numbers on a weekly basis, missing the reordering point becomes a likely possibility.

If you’re concerned about missing your reorder point, you may want to consider inventory management software for your business. Why?

  • Tracks your moving inventory across all channels
  • Allows you to monitor inventory at anytime
  • Once a product hits their reorder point, you get notified to place an order
  • Avoid stock out and lost sales

When you can automate your inventory processes, you become more efficient and disciplined. You can avoid backorders and letting down your customers, not to mention all the lost sales you could lose by not having enough product.

When you can keep the products on the shelf, customers will appreciate that and those customers will return.

*Accelerated Analytics publishes resources like this to provide insights to different analytical metrics, data points and formulas. Please be aware, we’re not claiming that our POS reporting services will offer this example or any other metric, data point or formula. To learn exactly what our reporting covers, please feel free to schedule a demo or give us a call. Thanks for understanding.


Retail Metrics: What Are The Most Important KPIs You Should Be Tracking?

Retail Metrics

Ever heard of the phrase, “the numbers don’t lie?” If something feels “off” in your business, the first order of business is looking at your retail metrics.

When it comes down to brass tacks, for any retailer big or small, your numbers don’t lie. Your numbers give you the cold hard truth (good and bad) and if you know how to track them, analyze them and implement action based on those numbers, you’ll always have a roadmap to growing your business.

Every retail is business is different, so your retail KPIs may differ from others. Some retail metrics like inventory, sales and customer data relate to all retail businesses.

The big question you should be asking yourself right now, “what retail metrics should I be tracking?” A great question, right? If you don’t know, this guide is going to teach you. If you do know, heck, you may just learn something new. Regardless of your level of experience, there’s no denying the fact that your numbers are everything. You’re either growing, stable or you’re down.

With that being said, let’s take a look at the most important retail metrics you should be paying attention to.

(1) Sales

While this is an obvious first choice, you’d be surprised by how many retailers don’t consistently track their sales. Sure, you have a general idea of how much sales you have but do you really dive deep into your sales? The bigger concern, retailers are not using their sales data to make better informed decisions as it pertains to their business.

If you want to improve your sales, you have to know what’s driving sales in the first place. There’s a ton of insights you can get from your sales data, a few examples would be;

  • Product A is consistently selling out in our Dallas store, let’s get more product there to make more sales.
  • Product B is selling 40 units per month online. Let’s see what’s driving those sales so we can replicate it for other products.
  • Our YOY is up 140 percent, what did we implement to achieve that type of growth?

Now, these are just a few examples but the ultimate goal is to use your sales data to improve…… “sales.”

(2) Conversions

Your conversion rates are going to tell you exactly how good you are at turning prospects into paying customers. Fortunately, there’s a ton of ways you can improve your conversions.

    • Reviews (The More You Can Add, The Better)
    • High Quality Images On Product Pages
    • Get Your Audience Excited About Your Products And Brand
    • Use Security Badges And Seals On Your Website
    • Make Sure Your Checkout Is Simple And Easy

A small boost in conversions can make a huge impact on your bottom line. You should always be looking for ways to get higher conversions. High conversions is going to allow you to sell more without having to grow your current audience, I’ll take that any day of the week and twice on Sunday.

(3) Gross Profit And Net Profit

Your gross profit is going to tell you how much money you’re making after deducting the costs of producing and selling the product. The formula to determine your gross profit is simple, it’s:

  • sales revenues – cost of goods sold

Now, your net profit is going to tell you how much money you made after you deduct your cost of goods along with any other business expenses you may have, which may include, operating expenses, administrative costs, etc. To get that total, just use the equation below:
all revenues – all expenses

Why should you analyze gross and net profit?

Another good question, your gross and net profit is going to tell you if you’re putting money into your pockets or putting it into your business to stay afloat. Generating sales and revenue is good, but at the end of the day, you need to make money out of those sales.

Tracking these KPIs will help you make smarter decisions in various aspects of your business. For instance, if your gross profit is on the low side, then you may want to look into product sourcing and determine if there’s a way to lower your cost of goods.
Not netting enough profit? Perhaps you should find ways to lower your operating expenses.

How do you improve your gross and net profit?

You can try several profit-increasing strategies in your business. Here are some quick ideas:

  • Streamline your operations to reduce expenses
  • Raise your prices
  • Increase your average order value
  • Implement savvier purchasing practices
  • Optimize your vendor relationships

(4) Year-Over-Year Growth

Year-over-year (YOY) is one of the most commonly used retail metrics, used to measure a company’s growth over an annual period. YOY is one of the fastest calculations you can do to see if a company is experincing growth, staying still or declining.

How do I measure year-over-year growth?

The goal for any business is to see continuous improvement. One of the best ways to see if that’s the case is by measuring your current results versus your past results. This will give you clarity on your company’s progress and as long as you’re tracking this every period, you’ll be able to make adjustments as needed to ensure you see continuous growth.

How can I improve YOY growth?

First, you need to make sure you’re tracking this every period. Furthermore, you should be documenting everything you do in your business. Some small merchants are selling millions in products, you may not have a team to help with tracking. To my point, every business has a different scenario. Even so, you can’t improve your YOY if you’re not tracking it.

(5) GMROI

Gross Margin Return on Investment (GMROI) measures your profit return on the funds invested in stock. It answers the question, “For every dollar invested in inventory, how many dollars did I get back?”

The formula for GMROI is:

  • gross profit / average inventory

Why should I measure GMROI?

GMROI tells you how much money your inventory has made. You use this metric to figure out if your stock is turning a profit. It’s typically measured for specific products or categories because it can give you a good idea of which types of merchandise are worth carrying in your shop.

How can I improve my GMROI?

To increase your GMROI, ask yourself, how can I get more money out of my merchandise? Accomplishing that can mean:

  • Increase The Price Of Your Products
  • Increase The Profit Margin Of Your Products
  • Lower Your Cost Of Goods
  • Improve Your Inventory Turnover

(6) Sell Through

Sell through is the percentage of units sold versus the number of units that were available to be sold. It’s expressed in percentage form using the formula:

The sell through formula is as follows:

  • number of units sold / beginning inventory x 100

Why should I measure sell-through?

Sell through is an awesome way to evaluate the performance of your merchandise. Sell through can also help you figure out how fast products are selling, allowing you to make the appropriate decisions when making future purchases.

For example, let’s say you’ve stocked up on a new style of athletic shirts and you saw that you’ve sold through 90% of your inventory in the past 7 days. For your store, this is super quick and unusual. Now, you can use your sell through formula to determine how much to order so you don’t run out.

How can I improve sell-through?

Improving your sell through can be a little tricky because every scenario is different. Honestly, it all depends on your specific situation.

If you have a high sell through rate, this could mean you need to stock up on that specific product.

If you have a low sell through rate, you may need to figure out how to sell more of that product.

Truth of the matter, there’s many retail metrics you should be tracking consistently. Doing so is going to allow you to grow your business and make better informed decisions on matters that relate directly with your business.

*Accelerated Analytics publishes resources like this to provide insights to different analytical metrics, data points and formulas. Please be aware, we’re not claiming that our POS reporting services will offer this example or any other metric, data point or formula. To learn exactly what our reporting covers, please feel free to schedule a demo or give us a call. Thanks for understanding.
 

What Is Year-Over-Year (YOY)?

One of the most popular and most used financial comparisons in the world is the year-over-year method, also referred to as YOY. By using YOY, anyone can compare two or more measurable events on a yearly basis. If you’re a retailer that collects POS Data, you’re likely familiar with YOY as your POS Reports likely give you that reporting option. YOY is an important metric that can be applied to many things to compare one year versus another.

For those that are looking at YOY performance, it gives you the opportunity to gauge and see if your financial performance is improving, static or decreasing. As you can imagine, that’s a very important measurement to know, in both business analytics and financials.

Explaining Year Over Year (YOY)

There’s a reason why year-over-year comparisons are popular, they provide an effective way to evaluate the financial performance of a company or the performance of investments. Any measurable event that repeats annually can be compared on a YOY basis. Common YOY comparisons include annual, quarterly, monthly and weekly performances.

Year-over-year (YOY) is a method of evaluating two or more measured events to compare the results at one period with those of a comparable period on an annual basis. YOY comparisons are a popular and effective way to evaluate the financial performance of a company. If investors are looking to gauge a company’s financial performance, they’ll be using YOY as one of the main data points for that evaluation.

Benefits Of Year-Over-Year (YOY)

YOY measurements facilitate the cross-comparison of sets of data. Let’s use a quick example. We’ll say investors are interested in a business and we’re currently in the first-quarter. The investors will focus on this company’s first-quarter revenue using YOY data, which will allow the financial analyst or investors the opportunity to compare years of first-quarter revenue data. This is an easy and quick way to see if the company’s revenue is growing, static or decreasing.

For example, in the third quarter of 2018, Company B reported a net loss of $18 million, year-over-year. Company B reported net earnings of $195 million in the third quarter of 2017, which showed a decrease in this company’s earnings from comparable, annual periods. This YOY comparison is super valuable for investment portfolios, investors like to analyze YOY performance to see how performance changes across time.

Why Companies Use Year-over-Year (YOY)

YOY comparisons are popular when analyzing a company’s performance because they help rule out seasonality elements, which can often be a big factor that influences your bottom line. Sales, profits, and other financial metrics change during different periods of the year because most lines of business have a peak season and a low demand season.

For example, retailers have a peak demand season during the holiday shopping season, which falls in the fourth quarter of the year. Black Friday is a great example here, Christmas also. To properly evaluate a company’s performance, it makes sense to compare revenue and profits year-over-year. Now, what about a swimming pool company, are they going to have seasonality factors? Absolutely, that company will have a peak season during the spring and summer months.

When you’re comparing quarter vs quarter, it’s important to compare the fourth-quarter performance in one year to the fourth-quarter performance in other years. If an investor looks at a retailer’s results in the fourth quarter versus the prior third quarter, it might appear a company is undergoing unprecedented growth when it is seasonality that is influencing the difference in the results. Similarly, in a comparison of the fourth quarter to the following first quarter, there might appear a dramatic decline when this could also be a result of seasonality.

YOY also differs from the term “sequential,” which measures one quarter or month to the previous one and allows investors to see linear growth. For instance, the number of software subscriptions a SAAS company sold in the second quarter of 2018 compared to the first quarter of 2018, or the number of golf clubs a company sold in October 2018 compared to September 2018.

*Accelerated Analytics publishes resources like this to provide insights to different analytical metrics, data points and formulas. Please be aware, we’re not claiming that our POS reporting services will offer this example or any other metric, data point or formula. To learn exactly what our reporting covers, please feel free to schedule a demo or give us a call. Thanks for understanding.

Ending Inventory Formula: How To Calculate EIF

Ending Inventory Formula

When it comes to important calculations for your business, ending inventory formula is one that’s super important. Ending inventory formula is used to calculate the value of goods available for sale at the end of the accounting period. When it comes to inventory management and utilizing your POS data, these formulas can play an important role in the decisions you make for your company.

Every company wants inventory control. Ending inventory is usually recorded on a balance sheet at the lower cost or its market value. Also referred to as Closing Stock, ending inventory usually have 3 types of inventory.

  • Finished Goods
  • Raw Materials
  • Work In Progress (WIP)

Now, there’s 3 methods used to calculate these. Let’s take a closer look at each.

First In First Out Method (FIFO)

If you’re using the First In First Out Inventory Method, it means the first item purchases is going to be the first item sold, which means the cost of purchase for the first item is the cost of the first item sold which would result in closing inventory reported by the company. That amount would be placed in the balance sheet showing the approximate current cost as its value, which would be based on the most recent purchase. If there’s inflation, ending inventory is going to be higher using this method compared to the other methods.

Last In First Out Method (LIFO)

If you’re using the Last In First Out Inventory Method, the last item purchases is going to be the cost of the first item sold, which would result in closing inventory reported by the company. That amount is placed in the balance sheet and would show the cost of the earliest items purchased. If there’s inflation, ending inventory is often less than the current cost. In this case, when prices are rising, ending inventory will be lower.

Weighted Average Cost Method

If you’re using the Weighted Average Cost Method, the average cost per unit is computed by dividing the total cost of goods available for sale. The ending inventory equation is value by multiplying the average cost per unit by the number of units available at the end of the reporting period.

Ending inventory formula is the value of goods or products that remain unsold or remains at the end of the reporting period (either the financial period or the accounting period). It is always based on the market value or cost of the goods, which ever is lower. It makes sense to keep track of the ending inventory as the same is carried forward to the next reporting period and becomes the beginning inventory. If there’s inaccuracies measured in the ending inventory, it will result in financial implication in the new reporting period also.

The valuation of ending inventory has a widespread impact on the various line items on the Income Statement, mainly Cost Of Goods Sold (COGS), New Profit and Gross Profit. On the Balance Sheet, it impacts Current Assets, Total Assets, Working Capital, which will impact several important financial ratios, such as Current Ratio, Quick Ratio, Inventory Turnover Ratio, Gross Profit Ratio and Net Profit Ratio.

Estimating Ending Inventory Formula

When it comes to estimating ending inventory formula, there’s two different methods you can use. It’s important to note that this is not meant to be completely accurate. After all, you’re using historical data to make an estimate. However, in most scenarios, it should be a close reasonable estimate.

With that said, here’s the 2 formulas.

  • Gross Profit Method
  • Retail Inventory Method

Gross Profit Method

  1. Add the Cost Of Beginning Inventory and Cost Of Purchases together during the proper period. This will give you your Cost Of Goods Available For Sale.
  2. Multiply by 1 your Expected Gross Profit by Sales during the proper period to get your Estimated Cost Of Goods Sold.
  3. Subtract the Estimated Cost Of Goods Sold (Step 2) from the Cost Of Goods Available For Sale (Step 1).

Note: The Gross Profit Method relies on historical gross margin, which may not be the margin experienced in your most recent accounting period. You may also have inventory losses in the same period. Both can influence your estimate.

Retail Inventory Method

The next method to use is the Retail Inventory Method. This is commonly used by retailers to calculate their ending inventory. This method used the proportion of the retail price cost in prior periods for the formula’s foundation.

  1. Calculate your Cost-To-Retail Percentage, the formula is (Cost / Retail Price).
  2. Next, calculate your Cost Of Goods Available For Sale, the formula is (Cost of Beginning Inventory + Cost of Purchases).
  3. Then calculate the Cost Of Sales during the period, the formula is (Sales x Cost-To-Retail Percentage).
  4. Calculate Ending Inventory, for which the formula is (Cost of Goods Available For Sale – Cost of Sales during the period).

It’s important to note that this method only works if you consistently mark up your products by the same percentage. You also need to have continued to use the same markup percentage in the current period. Discounts and Out Of Stock can have an impact on your calculation.

Remember, the last 2 methods are for estimating ending inventory only, you can’t beat using a physical count or cycle counting program, even using the methods we first shared above.

Inventory Control: What Is It And How To Control Any Amount Of Inventory

If you’re familiar with inventory management, you’ve likely heard of “inventory control.” Just in case you haven’t, inventory control refers to the process used to maximize a company’s use of inventory.

The main goal of inventory control is to generate the maximum amount of profit from the least amount of inventory. Among companies that have large inventory investments, inventory control is one of their main concerns, most commonly among retailers.

Inventory Control Types

There’s a few different inventory control types based on the different ways companies use their inventory.

(1) Finished Goods Availability: Companies that have high levels of finished goods on hand can usually charge a higher price for products if they can be shipped reliably. However, many companies won’t be able to invest in a lot of inventory at once, especially when it cuts into profits. This is where inventory control can help.

This is where you need a balance between allowed backorders with a smaller level of on-hand finished goods. You may even consider just-in-time manufacturing, just depends on your company and which inventory control method makes more sense.

(2) Raw Materials Availability: Having control over your raw materials inventory can be a big challenge for companies. When it comes to raw materials, you want to make sure you have enough inventory on hand to ensure production is always running at full capacity. On the other side, you don’t want your business investing in huge amounts of materials you don’t need at the moment. There’s a delicate balance to both sides.

So, how do we control inventory in this scenario? We order frequently but only in small lot sizes. Do suppliers like this? No, so if a supplier isn’t willing to do it, you need to look into sole sourcing so you can concentrate on just-in-time deliveries.

(3) Work In Process: If you can reduce the number of inventory items you have in your production process, you’ll be able to lower your inventory investment. You may be surprised when you dig down deep and evaluate what inventory may be removed. Not only that, there’s other things you can do that may make your production more efficient. For example, you may want to consider subassemblies, changing locations to reduce inventory travel time or reducing machine setup times.

(4) Reorder Point: One of the biggest pillars in inventory control is choosing the best optimal inventory levels for reordering additional inventory. If your reorder level is low, this can keep your inventory investment low but it can also improve the chances of a stockout. You don’t want a stockout. If your reorder level is high, you have a big inventory investment. So, what’s the right inventory control method in this scenario?

Demand forecasting and inventory forecasting can help for those of you that have a fair amount of sales data from your POS. In fact, our POS Reporting here at Accelerated Analytics can help you with your inventory management.

Bottleneck Enhancement: For most companies, there’s always a bottleneck somewhere as it pertains to the production process. These bottlenecks can cause interference in the whole operation. We can use inventory control, an inventory buffer that helps us continue to run despite failures that would otherwise hurt you.

Outsourcing Inventory Control

Some companies choose to outsource their inventory control, partial or whole as a way to shift the inventory burden on suppliers. While you may make less profit from doing so, it may be worth the investment to get rid of your inventory issues all together.

You also have another choice as it pertains to controlling your inventory, that’s our powerful POS And EDI 852 software suite. When it comes to managing your inventory across numerous stores, you won’t find a better software. Scheduling a demo is simple and easy, just click here and fill out the form. We’d love the opportunity to show you how our software suite can help you manage inventory and grow your company.

Demand Forecasting: What It Is And What You Should Know

Demand Forecasting

The definition of demand forecasting is exactly how it sounds, it refers to the process of using historical sales data to build an estimate of an expected forecast of customer demand. The purpose of demand forecasting is to provide your company with an estimate of the amount of services or goods that customers will purchase in the foreseeable future.

There’s a ton of data points and insights you can get with your POS Data, something we do here at Accelerated Analytics daily, which is helping companies with their POS Reports and EDI 852. These reports play a vital role in forecasting, not just forecasting inventory but also forecasting demand.

As it pertains to customer demand, there’s many other factors that influence it, such as cash flow, profit margins, turnover, risk assessment, capacity planning and mitigation plans. All of these are dependent on demand forecasting, so each plays a vital role in accurate forecast.

Demand Forecasting Types

Now, there’s different types of demand forecasting, it’s important to know each type and what it represents. Each one is classified based on the level of detail, time span considered and the scope of the market being forecasted. Let’s look at few.

Outlined below are the major types of Demand Forecasting:

  • Passive Demand Forecasting: Passive Demand Forecasting is used for companies that have a solid foundation but have growth plans that are on the conservative side. Simple extrapolations of historical data is carried out with minimal assumptions. This type of forecasting is rarely used, often limited to small and local businesses.
  • Active Demand Forecasting: Active Demand Forecasting is used for scaling and diversifying businesses that have aggressive growth plans in terms of marketing activities, product portfolio expansion and consideration of competitor activities and external economic environment.
  • Short-Term Demand Forecasting: Short-term Demand Forecasting is used for short term periods (usually 3-12 month periods.) When you’re using short terms, you have to take into consideration seasonal patterns of demand and the effect of tactical decisions on the customer demand.
  • Medium/Long-Term Demand Forecasting: Medium/Long-Term Demand Forecasting are usually used for 12-24 month periods in advance (some businesses use 36-48 months). Long-term Forecasting will drive a company’s strategic planning, marketing and sales planning, financial planning, capacity planning, capital expenditure, etc.
  • External Macro Level Demand Forecasting: This type of Forecasting focuses on broader market movements, which depends on the macroeconomic environment. External Forecasting are built for evaluating strategic objectives of a business, this could include expanding product portfolio, penetrating new customer segments, technological disruptions, even paradigm shifts in consumer behavior and risk mitigation strategy.
  • Internal Business Level Demand Forecasting: Just as the name would suggest, this type of forecasting focuses on the internal operations of the business. This could include product categories, sales division, financial division or manufacturing. Some of the internal forecast  include yearly sales forecast, net profit margins, estimation of COGS, cash flow and others.

Demand Forecasting Examples

There’s a number of different demand forecasting examples we can use, so we want to give you a few to walk away with. We’ll use Ford as an example. Ford wants to build a demand forecast on their Mustang 5.0 V8 for 2018. What do they do? They would look at the last 12 months of sales for this specific vehicle. They can use this data to forecast sales for the next 12 months, plus what they need for inventory and production. They can break sales down into each package, into category as needed. If they need to know how many 2018 Mustangs were yellow, they know. Likewise, they know the sales on each package they offer, as well as all the other accessories they offer customers.

A leading clothing company refers to the last 24 months of actual sales of a very popular women’s denim jeans. An analysis is carried out to look at a particular pair of jeans to build a demand forecast. Based on the market potential of the jeans, demand is forecasted for the next 12 to 24 months. The clothing company is tracking every product, every category, every size, color, design, etc.

Importance of Demand Forecasting

As you’re now learning, demand forecasting is a pivotal business process around which strategic and operational plans of a company are devised. Based on the Demand Forecast, strategic and long-range plans of a business like budgeting, financial planning, sales and marketing plans, capacity planning, risk assessment and mitigation plans can be developed.

Short to medium term tactical plans like pre-building, make-to-stock, make-to-order, contract manufacturing, supply planning, network balancing, etc. are execution based. Demand Forecasting also facilitates important management activities like decision making, performance evaluation, judicious allocation of resources in a constrained environment and planning business expansions.

Demand Forecasting Methods

One of the most critical steps of the demand forecasting process is selecting the appropriate demand forecasting model to use. There’s 2 methods that can be used to forecast demand, those are known as (A) Qualitative Methods or (B) Quantitative Methods. Within each type, there’s 3 different methods, we’ll explain these below.

3 Qualitative Methods:

  • The Delphi Technique: With the delphi technique, an expert panel is appointed to build a demand forecast. Each expert in the group will be asked to generate a forecast of their specific assigned segment. Once the initial forecasting round is complete, each expert will read out their forecast and provide their findings. Each expert is influenced by the other, the panel discussing each answer and the “why” behind the solutions given. Once everyone has made their case, they will do a new forecast and will continue to do so until everyone is in agreement.
  • Sales Force Opinion: With the sales force opinion method, the sales manager asks for inputs of expected demand from each member of the sales team. Each salesperson will begin to evaluate their respective region, product categories and once done, they will give their customer demand report. Once finished, the sales manager aggregates all the demands and builds the final version of demand forecast after management’s judgment.
  • Market Research: With this market research technique, customer-specific surveys are used to generate potential demand. Such surveys are generally in the form of questionnaires that directly seeks personal, demographic, preference and economic information from end customers. Since this type of research is on a random sampling basis, care needs to be exercised in terms of the survey regions, locations, and demographics of the end customer. This type of method could be beneficial for products that have little to no demand history.

3 Quantitative Methods:

  • Trend Projection Method: The trend projection method can be used for companies that have a lot of sales data history, typically you want at least 18 to 24 months of sales data. Historical sales data gives you a “time stamp” which shows you all of your past sales. You’ll also have your projected demand forecast for a specific product categories you can also utilize.
  • Barometric Technique: Barometric technique of demand forecasting is based on the principle of recording events in the present to predict the future. With this demand forecasting process, this can be accomplished by analyzing economic indicators. Most commonly, forecasters deploy statistical analysis like leading series, concurrent series or lagging series to build a Demand Forecast.
  • Econometric Forecasting Technique: Econometric forecasting utilizes autoregressive integrated moving-average and complex mathematical equations to help establish relationships between demand and factors that influence demand. An equation is gathered and fine-tuned to ensure a reliable historical representation. FLastly, projected values of the influencing variables are inserted into the equation to generate a forecast.

Demand Forecasting Objectives

  • Financial Planning
  • Pricing Policy
  • Manufacturing Policy
  • Sales Planning
  • Marketing Planning
  • Capacity Planning And Expansion
  • Manpower Planning
  • Capital Expenditure

Demand Forecasting Models

Some companies prefer to use their own demand forecasting model, which can include all the different factors a business wants to consider when forecasting demand. Most businesses will use an extension of the demand forecasting models from above or use various methods above into the equation. None the less, as you can see, there’s a wide range methods your company can use to forecast demand.

Price Analysis VS Cost Analysis

Price Analysis Cost Analysis

While both price analysis and cost analysis are familiar terms in business, the two terms are sometimes confused with one another or their true meanings are took out of context. We want to help you clear them both up as business analytics are always valuable to a company that knows how to read such data.

Cost analysis and price analysis are two unique methods of projecting costs for projects and programs. Price Analysis looks purely at the unit price from a vendor while Cost Analysis incorporates the reasonable cost to the vendor of producing that item to determine if the price quotes are fair and appropriate.

The Basics Of Price Analysis

Now, price analysis is usually the preferred method to analyze the price options for a product. With this concept, the price of one company’s products or services are compared against other products that would be an alternative. For example, if there’s 7 competitors submitting bids or proposals for a particular project,  a price analysis would include a detailed review of the benefits each product/service could deliver based on their quoted price.

Price analysis has 4 basic components;

  • Analysis Of Existing Price History
  • Comparing Competitive Bids From Multiple Vendors
  • Comparing Price To Internal Projections
  • Using Catalog Or Government Prices For An Item

Price analysis can be used whenever there’s several suitable and relatively equivalent options in a purchase decision. Let’s use government contract jobs as an example. Price analysis can be applied here, when several companies that offer the same services apply for a government contract, the company that can bid the lowest often wins. Requirements for pricing analysis also usually include that the product or service is available on the open market and that alternatives are relatively similar in benefits.

The Basics Of Cost Analysis

A cost analysis can be more of a challenge, this is because it usually involves more working pieces. Using this method involves a thorough review of the itemized product, service elements and related costs of the solution. Many businesses have purchasing managers or members who evaluate the value proposition of a proposal. Using past history, experience and general awareness of the costs of each part of the solution, a final decision can be determined based on the merits of the solution alone.

Cost analysis has 5 core considerations;

  • Personnel That’s Required
  • Total Hours Of Work By The Personnel
  • Evaluation Of Costs As Necessary And Reasonable
  • Resource Cost (Includes Raw Components And Machine Time)
  • Projected Indirect Costs (Could Be Warehousing, Transportation, Taxes, Fees)

The most simple point about cost analysis application is that it is used when price analysis isn’t possible. This is usually because there aren’t alternative solutions for comparison or no related proposals were submitted for a job. New types of research or product development work or solutions based on unique patents or products commonly require cost analysis. The challenge with cost analysis is trying to determine fair value with no marketable comparison.

Using Price Analysis And Cost Analysis Together

Most project managers will set up cost and price analysis worksheets in order to perform both projections at once. This allows a true comparison of the results so that they can be considered in the framework of a true value comparison of plans or alternatives.

Value consists of a constant evaluation of whether a process step or an item is critical to customer satisfaction or final execution. This is important as an item might be considered to be a  “good deal” but not necessary to the company’s business model.

We want cost and price analysis to be framed within the framework of a value analysis. Quality expectations affect the long-term value of a business project. The lowest cost or price vendor may not deliver sufficient quality and life span of product to meet the organizational needs.

A critical portion of the cost and price analysis is a clear and precise recommendation. If the analysis does not definitively lead to a value measure of the program or item in question, then additional reviews may be required.

In most scenarios, this analysis is a great tool for companies to standardize both cost analysis and price analysis expectations to ensure your employees and specific departments are adhering to strategic cost control methods set by supply chain leadership. This unity of process ensures a consistent approach to project value and one that you want to follow consistently.

What Is Price Elasticity Of Demand?

Price Elasticity Formula

Price Elasticity is used by economists to understand how supply or demand changes work in the real economy when price changes are made to a product or service. When it comes to setting the prices for your products and services, it can be a difficult decision to face. At some point, every company or business must decide on pricing. For the business owners, economists, data analysis, executives, even a marketers, this is no easy task.

Your pricing determines everything, especially the bottom line of your company. You have to understand pricing and what elements decide it. Economists refer to this by price elasticity. If you’ve never heard of it, don’t worry, we’re going to cover it from the start.

What Is Price Elasticity?

The majority of customers in several industries are sensitive to the price of a product or service. This assumption means that more people will buy a product or service if it’s cheaper and people will buy less if it’s more expensive.

It goes deeper than just that, price elasticity can show us how responsive customer demand is for a product based on its price point. You have to understand how sensitive your customers are too pricing, the price elasticity formula can give you that answer.

You’ll find that some products have an immediate response to price changes, these are usually products that are non-essentials. Most of these products have many substitutes customers could pursue. A good example to use is eggs. If the price of eggs dramatically increases and demand falls, people would find a way to substitute eggs.

How Is Price Elasticity Calculated?

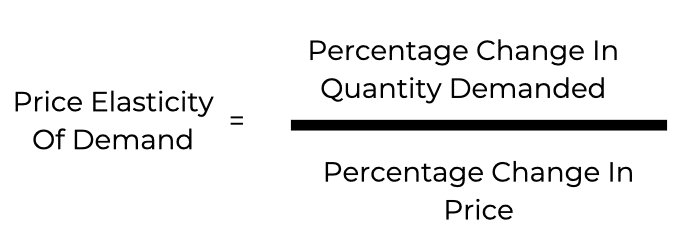
The price elasticity formula is simple.To better help you understand, let’s look at an example.

Calculating Price Elasticity Formula

Company XYZ has decided to raise their price on one of their name brand shirts from $80 to $100. The price increase is $100 – $80 is $20 or 20 percent. Now, due to the price increase, sales have dropped from 500 shirts being sold to 400 shirts sold. The percentage decrease in demand for the shirt is -20 percent. If we use these numbers in the formula, we get a price elasticity of demand.

Now, it’s important to note that we ignore the negative and the absolute value of the number is used to interpret the price elasticity metric. This is because the magnitude of distance from zero is what matters in the equation, not the positive or negative attached.

The higher your absolute value is, the more sensitive your customers are going to be to price changes. Pretty cool, right?

The 5 Zones Of Price Elasticity

There’s thought to be 5 zones as it pertains to price elasticity and your company falls into one of these 5 zones. It’s important to understand which zone that is so you know how your customers will react if you choose to hike your prices.

  • Perfectly Elastic – In this zone, there’s very small changes in price results in a very large change in the quantity demanded. Products that fall in this category are mostly “pure commodities.” In that case, there’s no attachment to the brand, nothing meaningful about the service, nor no product differentiation. Think water, gas, electric, etc.
  • Relatively Elastic – This zone is where small changes in your price cause large changes in quantity demanded (the result of the formula is greater than 1). Eggs, as discussed above, is an example of a product that is relatively elastic.
  • Unit Elastic – For this zone, this is where any change in price is matched by an equal change in quantity (where the number is equal to 1).
  • Relatively Inelastic – This is the zone where large changes in your price cause small changes in demand (the number is less than 1). Gasoline is a great example to use here because most people need it in their daily life, so even when prices go up, demand doesn’t change a lot.
  • Perfectly Inelastic – In this zone, this is where the quantity demanded does not change when the price changes. Products in this category are things consumers absolutely need and there are no other options from which to obtain them.

How Do Companies Use It?

There’s many ways price elasticity can be used to help a business. Every company has the task of creating unique services and products. Every company has the task of creating value for their customers. We can use price elasticity to measure how we’re doing in that area.

Our goal is to move product from relatively elastic to relatively inelastic. How can we achieve that? We use branding and marketing to build desire with our target audience. We want our customers to have desire for our products or services. When a company has built that desire, customers are willing to buy regardless of price.

Remember, price elasticity is only one metric that you can calculate when you raise the price of a product or service. Companies usually don’t use this in “practice.” Rather, they send out surveys, questionnaires or operate small focus group experiments in select industries. This allows them to get a sense of what may happen if a price change occurs.

While price elasticity is certainly something you want to understand and leverage, price sensitivity is more of a qualitative concept. Even so, price elasticity and price sensitivity are closely related.

Common Mistakes With Price Elasticity

While the price elasticity formula is not complicated, most companies assume they know how the marketplace will react with price changes based on their experiences alone. The majority of companies don’t do extensive testing on price changes. The companies that do, they usually only have a small sample size to test from.

It’s impossible to know how the market will react at every price point possible. Sure, you can get a good sense by doing your research, doing your studies, surveys and experiments. However, there can be a lot of inaccuracies in these test. Customers may say one thing but do another, it’s always difficult to have completely accurate data.

The best thing a company can do is A/B testing. You put Product A in the market, give it 2 price points and see what the demand is for both. Your feedback data will only get you so far. The only way to really know what a price change will do in the market is through A/B testing those 2 price points against one another.

Lastly, you want to understand consumer behavior to learn why your customers are reacting the way they are. Why did consumers react like this when we lowered the price? What did consumers say when we raised the price? If you can understand this now, it’s going to prepare you for what you do in the future. It’s going to help your marketing be more on point, you’re going to know where to focus your effort. As a company executive, you want to know these things so you can lead the marketing efforts in the right manner.

Most importantly, you want your products and services to stand out in the market versus that of your competition. You want your company to stay relevant, you want your company to clearly be different versus your competition. Understanding price elasticity of demand for your product doesn’t explain how you should manage it.

You want to understand your current price elasticity and those factors that make it either elastic or inelastic. These factors are always changing, it’s your job to know them and know them better than anyone else.

Elastic Glossary Terms

  • Elastic Demand – When the elasticity of demand is greater than (1), this indicates a high responsiveness of quantity demanded or supplied when price changes are made.
  • Elastic Supply – When the elasticity of either supply is greater than (1), indicating a high responsiveness of quantity demanded or supplied to changes in price elasticity an economics concept that measures responsiveness of one variable to changes in another variable.
  • Inelastic Demand – When the elasticity of demand is less than (1), this indicates that a 1 percent increase in price paid by the consumer will lead to less than a 1 percent change in purchases (and vice versa); this indicates a low responsiveness by consumers to price changes.
  • Inelastic Supply – When the elasticity of supply is less than one, indicating that a 1 percent increase in price paid to the firm will result in a less than 1 percent increase in production by the firm; this indicates a low responsiveness of the firm to price increases (and vice versa if prices drop).
  • Price Elasticity – The relationship between the percent change in price resulting in a corresponding percentage change in the quantity demanded or supplied.
  • Price Elasticity Of Demand – The percentage change in the quantity demanded of a good or service divided the percentage change in price
  • Price Elasticity Of Supply – The percentage change in the quantity supplied divided by the percentage change in price.
  • Unitary Elasticity – When the calculated elasticity is equal to one indicating that a change in the price of the good or service results in a proportional change in the quantity demanded or supplied.

Forecasting Inventory: How To Do It Right

How To Forecast Inventory

It doesn’t matter what type of business you run, an online ecommerce store or a brick and mortar store, inventory forecasting is vital to the success of your business. Think about it, what happens if you don’t have enough inventory on hand? Simple, you lose sales! What happens if you have too much inventory on your shelves? Well, it may mean we have too much cash tied up. We may also be in trouble if that product is not selling anymore. To our point, forecasting inventory is important.

Forecasting inventory plays a key role in proper inventory management.

So, here’s the real question, “how do you create the perfect balance of keeping inventory stocked while managing your cash flow?” That’s why we need inventory forecasting.

How To Forecast Inventory?

Great question! Since we need to figure out our inventory on hand, we’re going to start by forecasting our future sales. We’re going to forecast sales in 30 day increments. Here’s what we’ll have;

  • 30 Day Sales Forecast
  • 60 Day Sales Forecast
  • 90 Day Sales Forecast

We’re going to be relying on our past sales velocity for this forecast.

Before you jump in, here’s what you need to be on the lookout for.

  • Sales Velocity – Your sales velocity is the rate of sales that omit stockouts, also referred to as Out Of Stock Days. Why not just use average sales? We want to know our rate of sales when inventory was fully stocked. If we don’t omit days when inventory was out of stock, we would underestimate our future sales.
  • Seasonality – Many companies have trends for different seasonal times, so you need to be able to account for those trends when you’re forecasting your inventory. We always recommend using the past 12 months of data.
  • Sales Trends – If you’ve seen increasing demand, you need to make sure you account for this in your formula.

How Do You Treat Seasonal Products

Yes, another great question. Some of you have seasonal products, we have to treat these differently from year round products. Just to clarify, a seasonal product is going to be one that sells at a specific time of the year. If you’re thinking “holidays,” you’re absolutely right, that’s a great example. Other examples for seasonal product could be winter clothing or summer lawn care items.

In short, your default forecast projections will be steady sales month after month. Your seasonal forecast projections are going to see spikes at specific times of the year. Remember, they will also reference trends from the prior 12 months.

What About Forecasting Sales For New Products?

So many great questions, right? In all seriousness, forecasting new product sales can be a challenge. You don’t have the historical data we often rely on, so how can forecast sales and be accurate?

If your company has launched prior new products, we can go back to that historical data and it can help us forecast new product sales. You need to go back and examine the trends of your new product launches. If you haven’t been tracking that data, you better get tracking right now.

When you go through your past data, look at the trends. Did you see strong sales for the first 2 months and then sales trended down? Were sales strong and consistent for the first 6 months? If you’re using a similar formula for all your new product launches, this data can be invaluable for forecasting new sales.

Now, we do want to stick to the same category or brand with the forecast. We’re not saying you couldn’t use another category or brand, but we try to keep those 2 relative for our forecast.

Does Your Marketing Or Advertising Change During Forecast?

Yes, absolutely. If you have annual promotions or events, we need to account for that. If you’re doing that advertising or marketing every year, this is going to show in your 12 month sales data anyway.

If you’re planning on spending $30K this month on Google Adwords, you need to forecast for it. If you’re working with an affiliate partner for the month of October, you need to account that in your sales forecast.

Like we said earlier, you must pay attention to your trends. If August is your best sales month and that happens to co-exist with a big promotion, we want to accurately forecast those expectations.

What About Future Events Or Promotions?

If you’re planning an event or promotion in your upcoming forecast period, you need to account for it.

Remember, go back to your historical sales data. Here’s some questions we want you to ask yourself and answer.

  • Do we have the sales velocity from the same promotion last period?
  • Do we have the sales velocity from a similar promotion we ran?
  • What was the sales velocity the last time we spent $30K for marketing?

There’s a lot of great data points you can get from your past promotions to help you with forecasting inventory. If your past promotion was in the same period you used to calculate your sales velocity, you’ll likely not need to change your forecast much, if at all.

Replenishment VS Forecast

These two differ, so we wanted to clear this up (although you likely already know).

  • Replenishment – Refers to the additional stock needed to cover sales.
  • Forecast – An analysis that looks at the predicted sales for the next 30, 60, 90 days.

Now, replenishment focuses on 3 key pillars, your current stock levels, lead time with vendors and stock on order. Let’s break these 3 down.

  • Current Stock Levels – How much do we already have on hand?
  • Lead Time With Vendors – How long does it take for us to place an order, receive that order and have it inventory?
  • Stock On Order – How much product has already been ordered from a supplier and will arrive during our forecast period?

To better help you understand this, we want to use an example. This is a made up example but how it’s calculated is the right way.

We are forecasting to sell 600 units of vanilla brown candles during the next 30 days, which is our sales forecast. We have a total of 50 on hand and our lead time is only 3 days, so the replenishment is going to be 550 units. Our current sales velocity is 10 per day. Our current stock allows us to cover 5 days. Since our lead time is 3 days, we still need to cover 25 days of sales. At 10 a day, this is going to equal 250, which is the amount we need to cover the remainder of the 30 days.

Overstocked Or Understocked?

Now, you may be focused on seeing if you have enough stock to cover the next 30 days. Rather, perhaps you already know you have too much stock and you’re wanting to find out how much overstock you have on hand. How would we calculate these?

The first thing you need to do is figure out how many Days Of Stock you need to have on hand. Days of stock refers to the number of days you want to cover with inventory stocked in your store, this could be in your warehouse too. When you calculate days of stock, there’s a few things you need to know.

Lead Time – We talked about this earlier, you know this but lead time refers to the amount of time it will take to receive products from a supplier. This amount of time varies from one supplier to the next, so you have to know how long each product takes to get to your inventory.

If you have a short lead time, you can have short days of stock. If you have a long lead time, like 45 days, you’re going to have long days of stock. The days of stock will be equal to how often you need to place an order. For example, if it takes 45 days to get to us, it wouldn’t make sense to place orders every 10 days. Why? You don’t want several orders in transit at once of course.

Out Of Stock Cost – How Much Is Each Lost Sale Costing Your Company?

If a day of out of stock is going to cost you $7,500, you’re going to want to have more stock on hand. To determine your out of stock cost, you’ll want to multiply your sales velocity per day times the retail cost of that product.

Next, you need to subtract that number from your targeted days of stock, this is going to give you how many days are understocked or overstocked.

In Closing

Forecasting inventory plays a big role in proper inventory management. Our hope is you walk away now with a better understanding on how you can improve your own inventory forecast.

Here at Accelerated Analytics, our POS Reports allow you to make informed decisions that will make immediate impacts on your bottom line. POS Data can help you continuously grow your business, but only when your POS data is easy to read and understand. This is exactly why we recommend our EDI 852 reports. Schedule a demo today!

POS Reporting: What It Is And How It Can Grow Your Business

POS Reporting

While there’s a number of different data points that can help your business grow, few are as important as the insights you get back from your POS.

If you’re a retail business, analyzing sales data, inventory performances and employee sales is vital to the growth of your company. Before we dive in, what are POS reports?

What Is A Point Of Sale Report?

Point of sale (POS) reports are generated based on the data you gather from your point of sale systems. Register data and activities are tracked at a point of sale terminal, which stores data that can be used for analysis via POS reports. This POS analysis can help retailers;

  • Tracking Revenue
  • Analyzing Sales
  • Auditing Employee Performance
  • Inventory Purchases

While some companies only have a handful of products to sell, others can have thousands of products or more. Knowing how every product is performing is essential to your growth. There’s a lot of things we want to know;

  • What’s our best performing products?
  • Which products are selling the most?
  • Which products are underselling?
  • What employees are performing the best?

Fortunately for us, we have POS reports that breakdown all these different areas in your business. Our point of sale report can give us insights that allow us to make informed business decisions, make the “right” decisions. We can use this POS data to help our company grow sales.

Most importantly, we can see what’s working, what’s not working and we can build a strategy around the strengths and weaknesses of our company. You do want to make sure you get a POS system that has great reporting features.

Now, POS reports for retailers have a lot of different data points for you to analyze. While every one of them can be valuable, there’s 3 specific categories that get the most attention. Those categories are;

  • Store-By-Store Sales
  • Store-By-Store Inventory
  • Employee Transactions

With these 3 categories, we can learn a lot and those analysis will allow us to make the right decisions for our retail business. It allows us to see which stores are performing best, store sales trends, inventory flow, how funds are flowing in the business and much more.

Now, let’s dive a little further into POS reports so we can discuss everything they can tell our business.

Simplifying Your Sales

If you’re having to track sales for 100+ different locations, 10,000 different products, it can be a hassle to say the least. While you likely have software that does most of the heavy lifting, all that data is no good to you if it’s not easily accessible. This is where POS reporting can help, implementing all of your sales data in an easy to read report. This report is known as a EDI 852 report.

When we think about sales, most imagine a transaction taking price, right? Here’s the thing you have to remember, sales can be a longer process. We’ve talked about this before in our guide on sales cycles, it’s much more than just the bartering of goods for money.

In the retail industry, sales include gift cards, discounts and returns. The right point of sale terminal reports on all of these, sale of goods, cost of goods sold (COGS), number of returns and implemented discounts.

Efficient Inventory Management With POS Reports

POS inventory reports allow retailers to see stock level data, allowing them the opportunity to account for sold/unsold inventory items. Proper inventory management is crucial to the success of your retail store. No retailer can afford profit losses, having internal processes for your inventory management is key to your success.

Tracking Employee Success With POS Reports

When you think about tracking your employee success, you likely think of “performance.” While there’s a number of different ways you can evaluate employee performance, one way is with POS reporting.

If you didn’t have POS, you’d have to use software or manually track how many goods each employee is selling. POS staff reports help you manage staff productivity and calculate commissions. Staff reports also help you identify what’s being sold and who is selling it.

Most point of sale systems have inventory reporting tools that allow to catalog stock items. This data usually includes inventory value, inventory quantity and profit margins. Using inventory reporting tools with POS reports allow you to;

  • Shift Prices And Margins
  • Keep Items In Stock For Top Selling Products
  • Remove Items That Are Holding Shelf Space
  • Identify Overperforming And Underperforming Items

Be Careful – All POS Reports Are Not Equal

While there’s a few different companies out there that offer POS reporting, many of them will overload you on the data. Here at Accelerated Analytics, we know the key metrics you need to see. Our POS reports are easy to read, easy to understand and focus on the main data points you want to see. Our POS report is easy to read and extract.

You also need to be careful when choosing your point of sale system. Sure, you want a POS system that has standard reporting features. However, you also want a POS that is easy to use and feature rich.

Standard POS System Features

Here’s some of the features you want to see in your point of sale system.

  • Top Selling / Worst Selling Products
  • Top Customers
  • Sales By Time-Frame
  • Sales By Employee
  • Employee Payouts
  • Hours Worked
  • Shift Reports
  • Voided Sales
  • Discounts
  • Liabilities (Example: Gift Cards)
  • Refunds
  • Transaction Tender
  • Gross Profits
  • Taxes
  • Inventory Tracking

How Accelerated Analytics Can Help

Here at Accelerated Analytics, our powerful POS reports will give you the opportunity to dive deep into your POS data and efficiently analyze all the key data points that matter in your business.

If you don’t know how to use your POS data, it does you no good. Our POS reports collect all of your data, giving you an easy to read POS report.

Accelerated Analytics is currently working with point of sale data from more than 100 retailers. We can set up a new retail data source in as little as one business day and we can handle data in nearly any format including EDI 852, downloads from retailer portals, XLS, PDF, and text files.