Author: Chad Symens

Gaps still exist between vision and reality for EDI 852 data

In a recent conversation with a well known CPG vendor, it became very clear that vendors are still confused by data quality when it comes to EDI 852. Simply put, vendors are struggling with the known and unknown data quality issues that exist with the data retailers send out via EDI 852. Specifically, vendors are increasingly aware that on-hand inventory levels reported in EDI 852 are often suspect at best.
 
This vendor asked a very pointed question; “Why can’t retailers get this right, and more importantly, how do they expect us to make decisions on bogus data?” This is a serious challenge and one that needs to be addressed by retailers. If they expect vendors to monitor in-stock and make accurate decisions, the data quality must improve. Fortunately, there are strategies to improve upon the data reported by retailers in order to arrive at a useful decision making tool.
 
First, each vendor has an accurate count of how many units the retailer purchased and they know when the inventory is to be shipped. By subtracting the units sold as reported in the EDI 852 from the shipped inventory units, you can calculate an on-hand value. The key to this work-around is a good starting point. In most cases, this can be determined by examining inventory history and requesting from the retailer a one time inventory position count. It’s not a perfect system, but over time, the calculated on-hand becomes more and more accurate and it is a useful decision making tool. There are other strategies as well, but we see this as the most common method for handling poor on-hand reporting accuracy.
 
What strategies are you using to deal with poor data quality?  More importantly, what retailers are you working with that are not reporting accurate on-hand?  Many times, the starting point is simply identifying what data you can trust and what data you can’t. 

JC Penney EDI 852 Reporting

If you are a vendor supplying to JC Penney, you are eligible to receive product sales activity and inventory data via EDI 852. Preparing to setup and receive the EDI 852 files can be confusing, and creating usable reports for your team can be very time consuming. Fortunately, Accelerated Analytics® provides a simple, outsourced service for all your JC Penney EDI 852 reporting needs.

Using Accelerated Analytics® makes all your reporting headaches go away. With Accelerated Analytics®, we handle all the data conversion, database hosting and reporting. We even provide training and the end user reporting tools. 

Accelerated Analytics® benefits:

  • Eliminate manual data entry and manipulation
  • Consolidate all JC Penney store data on all your SKU’s into one reporting database
  • Pre-built exception reports with color coded dashboards
  • No software or hardware to purchase
  • Sophisticated charts and graphs

Available reports:

  • This weeks sales and inventory by store and SKU
  • Last weeks sales and inventory by store and SKU
  • This months sales and inventory by store and SKU
  • 6 week rolling sales and inventory by store and SKU
  • Sell-thru
  • Inventory turns
  • Days supply on hand

Accelerated Analytics® will give you the ability to anticipate changes in sales and inventory, so you can make adjustments before a costly mistake occurs. Our EDI 852 reporting is the best on the market. 

Home Depot EDI 852 Reporting

If you are a Home Depot vendor, you are eligible to receive product sales activity and inventory data via EDI 852. Preparing to setup and receive the EDI 852 files can be confusing, and creating usable reports for your team can be very time consuming. Fortunately, Accelerated Analytics® provides a simple, outsourced service for all your Home Depot EDI 852 reporting needs.  Our team works with dozens of Home Depot vendors like Quickie, W.M. Barr, Techtronic Industries, Worthington Cylinders, Trex, and many more.  

Using Accelerated Analytics® makes all your reporting headaches go away. With Accelerated Analytics®, we handle all the data conversion, database hosting, and reporting. We even provide training and the end user reporting tools. 

Accelerated Analytics® benefits:

  • Eliminate manual data entry and manipulation
  • Consolidate all Home Depot store data on all your SKU’s into one reporting database
  • Pre-built exception reports with color coded dashboards
  • No software or hardware to purchase
  • Sophisticated charts and graphs

Available reports:

  • Sales by BYO
  • Sales by Market
  • Sales Velocity by Store (A,B,C,D,E)
  • This weeks sales and inventory by store and SKU
  • Last weeks sales and inventory by store and SKU
  • This months sales and inventory by store and SKU
  • 6 week rolling sales and inventory by store and SKU
  • Sell-thru
  • Inventory turns
  • Days supply on hand 

Accelerated Analytics® will give you the ability to anticipate changes in sales and inventory, so you can make adjustments before a costly mistake occurs. Our EDI 852 reporting is the best on the market. 

POS Analysis – Analysis and Reporting Made Easy

Still messing with manual?

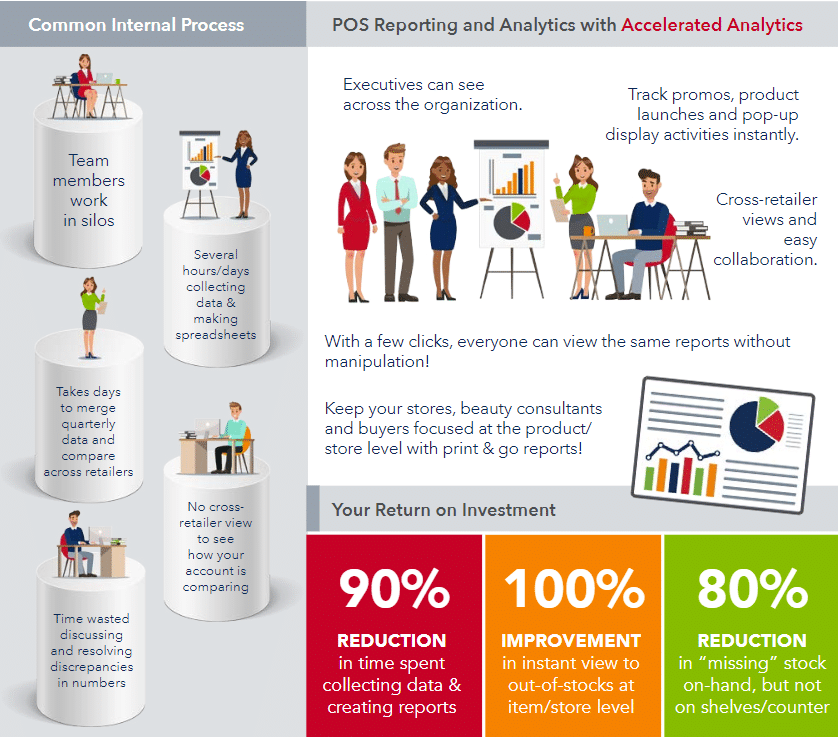
If you are a vendor supplying to a retailer, you are no doubt receiving POS and inventory data. Sorting out all of that data can be a real headache, considering the files can be different for each retailer. Your team probably spends hours each week manually entering data, creating spreadsheets and then preparing reports.

Accelerated Analytics® can eliminate all of this wasted time. As a SaaS, we will gather all of your POS data files automatically – no software to purchase or hardware to support.

Using Accelerated Analytics® eases your POS reporting headaches. We handle the data conversion, database hosting and reporting. We even provide training and the end user reporting tools. 

Accelerated Analytics® benefits:

  • Eliminate manual data entry and manipulation
  • Consolidate all retail data into one reporting database
  • Pre-built exception reports with color coded dashboards
  • No software or hardware to purchase
  • Sophisticated, easily exportable charts and graphs

Available reports:

  • This week/last week sales and inventory by store and SKU
  • This month/last month sales and inventory by store and SKU
  • 6 week rolling sales and inventory by store and SKU
  • Sell-thru
  • Inventory turns
  • Days supply on hand
  • and more! Just ask us.

Accelerated Analytics® will help you with accurate forecasting changes in sales and inventory, so you can make adjustments before a costly mistake occurs. Our POS reporting is the best on the market.

Supply Chain Analytics: Challenges and Solutions

Retailers and vendors in today’s retail market face the unenviable challenge of reducing costs and maintaining margins, despite falling overall sales and slow-to-recover consumer demand. One of the areas in which retailers are pushing back onto vendors is inventory management, which for vendors too often translates into retail partners that reduce overall inventories and require tightened delivery deadlines.  Retailers view the supply chain as one of the key places in which costs can be reduced—or better yet, passed off onto someone else—as a means of keeping shareholders happy despite reduced POS sales.  Wal-Mart continues to set the pace in this area, reducing its overall inventories across the board, reducing its brand assortments[1], adjusting its purchasing methods[2] and imposing tough penalties on those that miss their Must Arrive By Date (MABD).[3]

Thus, the impetus has fallen to vendors to manage their supply chains more efficiently, so that the cost-savings being realized by their retailers’ inventory adjustments might trickle down to them as well instead of becoming a proverbial albatross.  And while the “glass pipeline” may remain elusive, industry experts postulate that, “Visibility of supply chain costs have never been better.”[4] Since, then, there remains continued pressure on everyone in the industry to reduce costs, there exists an opportunity now to address supply chain optimization unlike any time before.

As in all such processes, the first step in addressing this optimization is identifying the major challenges, which, while not simple by any means, can be boiled down to three major focal points:

  1. Reduce supply chain costs
  2. Improving the responsiveness of the supply chain
  3. Managing demand volatility and Variability[5]

From an IT perspective, there are things that can be done with the data already being generated or received by most companies (even small ones!) to address some significant portion of each of these.

Reducing Supply Chain costs

While the operating costs of a supply chain are often the easiest numbers to point to, and the most difficult for IT to address, there are data sources that can be leveraged to reduce costs.  For example, purchase orders, shipping data and RTV (return to vendor) data is either generated internally or is received from retail partners (sometimes in a very straightforward EDI 812 document).  Unfortunately, for many companies, these data sources come from disparate business systems and are stored in multiple locations, so tracking a single PO from the time the order was received through the supply chain to its delivery at a store or in a DC, is an arduous task requiring proficiency in Excel and fraught with the potential for human error.  Further, when compounded by the volume of orders received that many vendors keep up with, the task of tracking becomes futile, since the actionable information it generates rarely is identified in time to take the given action, but rather is often merely a confirmation of what has already been made known by the retail partner that fined the vendor the late delivery or shorted pallet.  Thus, the lost efficiency of the analysts and the fees assessed by the retailers become additional costs in too many cases, and analysis of this data is simply not conducted.  However, those vendors that are able to aggressively track this data and address issues that may arise in a timely manner, can avoid fees and improve their relationships with their retailers.  Unfortunately, upper management often struggles to see beyond the concrete costs figures and consider these less concrete, but no less important opportunities for increased revenues or avoided fees.

Improving Responsiveness and Managing Demand Volatility and Variability

The delayed turnaround inherent in the difficulties discussed above relate directly to improving the responsiveness of the supply chain.  That is, supply chain utilization must address two areas of responsiveness:

  1. Responding to existing issues
  2. Responding to potential issues

Existing issues, as already discussed, are difficult to ID, due to the disparate sources of data and the corresponding amount of time it takes to collate the information and determine what issues actually exist, since addressing existing issues is time-sensitive.

Potential issues are no less difficult, since these are often identified by considering all the aforementioned data sources and then including additional data sources such as POS data (from which forecasts are derived).  Mike Griswold, VP Retail for AMR Research, says, supply chain optimization “involves better forecasting methods and moving away from looking at warehouse shipments and toward POS and online sales data.” He goes on: many vendors fail to utilize POS data effectively for addressing supply chain issues because “it’s easier to get your arms around warehouse shipments because you’re dealing with weekly or twice-weekly sources of data.  When you get to POS, you’re getting down to day-level granularity for items and stores, and creating a forecast for three or four weeks out requires a fair amount of processing power.”[6] Of course, Griswold qualifies his position—forecasting based on POS and other data sources isn’t the final step.  “Retail is not designed to be an inventory holding area,” he says. “You may [get] an order for 1,000 televisions to be deployed across 100 stores, but not every store can handle 10 of each item.”[7]

Thus, forecasts must be based on actual POS historical sales, current trends and other considered supply chain factors, and tempered by the limitations of the stores for which the forecasts are generated.  Retailers provide a shelf-space and assortment designation (called plan-o-grams, modulars, sets, etc.) for most vendors which allows vendors to consider these factors when filling orders, and combined with their own warehouse quantities and capacity, now a very comprehensive and useful picture emerges, from which one may then deduce those potential issues and act to address them, instead of reacting after they become a time-sensitive emergency.

How Accelerated Analytics® Can Help You Optimize Your Supply Chain

Unfortunately, University of Pennsylvania professor of Operations and Information Management Marshall Fisher says, the industry trend for vendors faced with the decision to have too little inventory and lose sales or have too much and be forced to liquidate, leans toward the former. “Most companies are just moving along with less inventory. They are downsizing to meet less demand and accepting higher stockouts. The risk of a lost sale is smaller than having lots of unsold inventory.”[8]

But, what if you had an integrated database solution that tied all of the disparate sources of data together into a single source of truth, from which actionable decisions could be made on timely, comprehensive data? Accelerated Analytics was first a business intelligence (BI) company and its expertise in BI solutions can be leveraged to create such an integrated database behind the Accelerated Analytics® interface, creating a powerful, yet user-friendly tool, that business users need and which management can understand.

Advantages offered by Accelerated Analytics®:

  • Integrated database to tie together all your data sources (P.O. files, Shipping documents, POS data, Plan-o-gram files, and more!) in a single location from which may be derived a single source of truth.
  • User-friendly reporting solution which provides rapid access to any of the data in the system and reduces the overhead normally associated with the collation and calculation of data
  • Exceptions reporting to identify shipping delays, stockouts, etc. automatically as often as required.
  • Proven forecasting methodology to generate proactive forecasts based on actual sales and inventory information

[1] Reda, Susan. “With SKU Reductions Under Way, Which Will Survive?” Stores.  . March 4, 2010.

[2] Birchall, Jonathan. “Walmart Aims to Cut Supply Chain Cost,” Financial Times. 3 Jan 2010.

[3] Cassidy, William. “Wal-Mart Tightens Delivery Deadlines.”  The Journal of Commerce. http://www.joc.com/node/416490. 8 Feb 2009.

[4] Lewis, Len.  “Delivering the World: Navigating obstacles in pursuit of global supply chain optimization.” STORES Magazine. . February 2010.

[5] Based on the results of a Supply Chain Leaders’ survey conducted by IGD, a London-based consultancy.  Lewis, Len.

[6] Lewis, Len

[7] Lewis, Len

[8] Lewis, Len

You’re not the only one

I sat down with an analyst at a consumer products company the other day, and had an in depth conversation with her about the process she goes through to export data from Retail Link and transform the data into reports for her management. I’ve been working with Walmart vendors for a long time, so I have a good awareness of the effort that it takes to go from raw data downloads to finished reports, but this detailed conversation was an eye opener. There were 17 unique steps to get from point A to point B and they consume about 13 hours per week. The process starts on Monday morning and reports are distributed to management before lunch on Tuesday morning. Management reviews the reports and then typically sends follow up questions and requests for detailed drill down as the week progresses. One weeks cycle runs into the next week’s, and on and on it goes.  If you’re shaking your head and saying, “yep, that sounds just like my job”, maybe you can take some satisfaction in knowing you’re not alone. Keep up the good work, knowing what’s’ happening at the point of sale is critical and your efforts are making it happen.

BI in the Supply Chain

I read this very good article yesterday and wanted to share it. 

Business Intelligence and Performance Management Rising to the Top of the Supply Chain Executive’s Agenda


By Viktoriya Sadlovska and Nari Viswanathan
 
In the context of today’s complex demand-supply networks, in which visibility into key performance indicators across the entire network is key to business success, companies have begun focusing more strongly on their supply chain Business Intelligence (BI) capability, as a key enabler of strengthening or regaining control over their supply chain networks. Focus on supply chain BI will remain strong in 2010, contributing to operational and strategic supply chain improvements at the top-performing companies. 
 
The only way to ensure that a business is able to adapt to changes fast enough is to establish an adequate level of supply chain intelligence, i.e. put in place processes and tools to effectively monitor supply chain performance and notify specific process owners and managers before problems turn into disruptions. These capabilities should not only serve as each supply chain’s operational “command and control” center, but also help uncover new revenue and savings opportunities with the help of advanced analytics.
 
In order to successfully monitor, capture and analyze performance data in a complex supply chain, top-performing companies across industries have implemented a series of capabilities and software enablers to help them in managing this mass of information. Having a supply chain business intelligence technology that is designed to integrate data and event flows across the broad array of departments, functions and roles within the global enterprise is an advantage versus an infrastructure that is not designed with such robust connectivity and functionality. A company needs to be able to integrate information across internal and external groups and trading partners and enhance collaboration and agility during tracking and responding to the myriad of supply chain events.

Dashboards and Scorecards
Multiple Aberdeen research studies have shown that Best-in-Class companies are more likely to use internal dashboards to measure supply chain performance, and external scorecards to measure their supply chain partners’ performance. Scorecards help companies formalize the evaluation of supply chain partners’ performance in order to improve the supplier and services provider selection process, potentially adopt performance-based incentive programs, and improve overall supply chain partner relationships.
 
It is important to ensure the adequate quality of the data feeding the above-described systems. Even if information is timely, it is worth nothing if it is inaccurate. In Aberdeen Group’s recent study – Supply Chain Intelligence: Adopt Role-Based Operational Business Intelligence and Improve Visibility – Best-in-Class performers dedicate a lot of effort to making sure that the data exchanged is accurate and complete, which enables them to make the right decisions for their supply chain. Best-in-Class performers in this study are 85% more likely than all others to report that data obtained during supply chain monitoring is accurate over 90% of the time (48% versus 26%). Some solution providers offer their customers help in cleansing the data, or even embed the data cleansing capability into the systems.
 
In the same study, when asked how companies planned to improve supply chain visibility software capabilities, responses included:

  • Improve data quality and timeliness of status messages – 66%
  • Enhance analytics capabilities – 56%
  • Add warning alerts if actual events deviate from plan – 46%
  • Incorporate additional status events – 40%
  • Increase the number of trading partners providing status information – 40%
  • Add escalation policies to help manage alerts – 30%

Best-in-Class respondents were 21% more likely than all others to focus on improving the analytics capabilities. Supply chain analytics (e.g. dashboards showing on-time versus late shipments along with detailed shipment information, charts and graphs with information on current shipment location and accumulated landed costs) are contributing to more effective decisions, improving both the quality of supply chain decision-making and time-to-response.
 
As a result of superior process and technology capabilities, coupled with a stronger focus on data quality and timeliness, Best-in-Class companies are between 19% and 42% more likely to respond to non-catastrophic supply chain disruptions within hours. The biggest differentiation is on the international inbound side: 51% of the Best-in-Class report this ability, versus 36% of all others. This means that if, for example, a shipment gets held up at a foreign port, they will be notified of this delay within hours and will not miss the opportunity to re-plan the route or resolve the issue fast enough to have the cargo shipped within the acceptable time window.
 
Companies need to obtain appropriate tools for tracking and managing network-wide supply chain performance and collaborative workflows. Network-wide supply chain intelligence paves the way for companies to have the most complete view of their business, including the potential impacts of their customers, suppliers, and other partners’ performance on the company’s bottom line. With such a 360-degree view of the business, executives can adopt the best supply chain strategies to meet the changing business needs.
 
The benchmark report Supply Chain Intelligence: Adopt Role-Based Operational Business Intelligence and Improve Visibility is available for free download for a limited time. Click here to download before April 23, 2010
 
Viktoriya Sadlovska is Researcher, Product Value Chain Benchmarking & Analysis at Aberdeen Group. Nari Viswanathan is VP/ Principal Analyst, Supply Chain Management at Aberdeen Group.

Calculating Weeks of Supply

A metric fundamental to managing the retail supply chain is weeks of supply (WOS). Weeks of supply tells the inventory manager how long the current on hand will last, based on current sales demand.  By keeping your eye on weeks of supply, you can avoid inventory stock outs and lost sales.  The basic calculation for weeks of supply is pretty simple: on hand inventory/average weekly units sold.  However, our work with vendors demonstrates that calculating an accurate and useful weeks of supply can be anything but simple.  Let me explain.  An EDI 852 document will provide units sold and on hand.   Very few EDI 852 documents provide data for inventory on order, inventory in transit or inventory in the warehouse.  More sophisticated systems like Wal-Mart’s Retail Link will provide the additional inventory data.  So ,the first issue an analyst working only with EDI 852 must overcome is to gain a complete picture of the inventory in the supply chain – all the inventory.  If you are working with a Home Depot 852 or a Lowe’s 852, you must also gather your purchase order and shipping data, so that you have the ability to understand on order and in transit inventory.  You must also decide how to apply inventory in the supply chain.  That is, will you sum on hand + on order + in transit  to use as the numerator in your calculation?  Or, perhaps you would prefer to ignore the on order due to long shipping lead times and use on hand + in transit.

The next consideration is, how to calculate the average weekly units sold which is the denominator in the weeks of supply calculation. This requires some careful consideration.  If the number of weeks used to calculate the average is not selected correctly, you will arrive at a misleading result.  Consider, for example, the sales for two vendors, as seen in this chart.  One vendor has products which are non-seasonal and tend to have very steady and consistent sales.  The other vendor has products which are seasonal and sell much higher in the warm spring and summer months.  When choosing the number of weeks for calculating the weeks of supply, you want to consider the rate at which your demand changes.  If your demand is fairly steady, like the non-seasonal vendor, a larger number of weeks can be used.  If, however, your demand tends to change rapidly, due to seasonality or based on some event like selling licensed apparel during football season, then you should choose a smaller number of weeks.  Our experience shows that a seasonal vendor should consider a four week window of sales demand and a non-seasonal vendor should choose 8 to 10 weeks.

The final point to make about calculating weeks of supply, is to consult with your retail buyer on the period of demand they are using.  If you are using four weeks, and they are using six weeks, you will arrive at different order quantities.  By discussing the calculation, you may find that your method is more accurate or you may find that the retailer has good reasons for their method.  If you still feel your method is more accurate, then calculate weeks of supply using both methods and track the accuracy over time.  This will provide you with the factual data to either change your calculation method to align with the buyer’s, or demonstrate to them why your calculation is more accurate.

Retail Replenishment – How tuned in are you?

I spent about 9 hours yesterday analyzing sales, order and forecast data for Walmart, Home Depot and Lowe’s vendors, and I am somewhat surprised by my observations.  It’s pretty clear that there are some min/max rules in place, as I can see patterns to the order quantities based on the OH inventory and the order case pack quantities.  However, what surprises me is that I also see a large number of what I would guess are “manual overrides.” That is UPC/stores which clearly need inventory and fall under the minimum OH of other stores, but which do not have an open order, and UPC/stores that are clearly overstocked (e.g. high WOS), and yet have an open order.  It makes sense that there would be automated replenishment rules in place and then some lead-way for the buyer/replenishment manager to make judgment calls, so that leads me to my question….

What do you know about your key retail customer’s replenishment rules?

  • Simple min/max ordering?
  • Based on OTB dollars?
  • WOS trigger?
  • At what level is demand calculated?  e.g. Category/Region, Category/State, Sub-category/State
  • Under what situations will the buyer do a manual override?

Store Level Merchandising Analysis Using EDI 852

The following is a step by step process to aid replenishment vendors in identifying stores on an item level basis, that are losing sales due to inventory stock outs or inventory that is present but unavailable for sale.  Such unavailable inventory may include lost or damaged items or items on the shelf but not available to the customer for any of a variety of reasons.  This process assumes that the vendor is receiving accurate and detailed EDI 852 Product Activity Data (or POS data via Retail Link or Partners Online, etc) on no less than a weekly basis from their retailing partners.  This article will focus on identifying and addressing underachieving stores.

Step 1
The vendor will calculate average weekly sales velocity (Avg WS) at an item level across all stores.  This is best calculated using the most recent twenty-six weeks of sales.  Thus, for a given item, the calculation would be:

Sum(last 26 wks. unit sales) = Avg WS
                               26

Step 2
Calculate the average item sales velocity (Avg WS) for each item for all stores for the last ten weeks of sales.  For each item, look at the last ten weeks of unit sales at the store level and separate the items by store into five categories.  For ease of identification, label these categories A-E.  The categories are as follows:

A.  Most recent two weeks of sales.

  • Stores with sales in the last two weeks for any given item will fall into this category

B.  Most recent four weeks of sales.

  • Stores with no sales in the last four weeks for any given item will fall into this category

C.  Most recent six weeks of sales.

  • Stores with no sales in the last six weeks for any given item will fall into this category

D.  Most recent eight weeks of sales.

  • Stores with no sales in the last eight  weeks for any given item will fall into this category

E.  Most recent ten weeks of sales.

  • Stores with no sales in the last ten weeks for any given item will fall into this category

The total percentage of sales of any given item for a given category can be accurately calculated by dividing the number of stores per item in any category by total stores (TS).

Total Stores in a Category  = % each category is of the total
(TS)

This percentage calculation is a better, more accurate way to judge relative performance of each category than by comparing unit sales.

Identifying & Addressing Underperforming Stores 
The remaining article focuses on underperforming stores, that is, stores that fall into categories D or E.  Now that you know how many stores are in categories D or E, go back to the list of items and the last 10 weeks of sales, and identify what store numbers are present in the bottom two categories and not in any of the other categories. These stores are stores with no sales in the past 8-10 weeks.  Pull the current inventory on hand for each store.

Out of Stock Stores 
Stores with no sales and zero inventory on hand are most likely out of stock stores.  Vendors will want to identify the last week that a given store recorded a sale for a given item in categories D-E.  The vendor can then estimate lost sales by unit for that item/store combination by multiplying the number of weeks since the last sale by the average weekly sales (Avg WS) calculated in Step 1.

(Avg WS) *[Sum(weeks w/o sales)] = Lost sales by unit due to stock-out (LU)

Lost sales by unit (LU) can also be multiplied by the price of the item to determine lost sales in terms of revenue (LR).

(LU) * (price of given item) = LR

Inventory stock-out problems are typically due to one of two things: Inaccurate inventory replenishment reorder points or inventory availability issues on part of vendor.  If that item was out of stock due to high reorder quantity, then a vendor can contact the replenishment manager at the retailer responsible for the underperforming store(s) and suggest changing the inventory replenishment set point, using lost revenue (LR) as the rationale for the recommendation.  This exercise can be performed for all item/store combinations that had few or no unit sales for an 8-10 week period (categories D-E) and showed no inventory on hand.

Stores with Inventory on Hand, But No Sales
Some of the stores are going to reflect no unit sales in the past 8-10 weeks, but still have on hand inventory. This typically indicates inventory which is misplaced, lost, stolen or stock on the shelf, but out of view of the customer for whatever reason.  It may also include damaged inventory and inventory otherwise unavailable for sale.  In this case, the vendor would contact the retailer and investigate the problem.  The inventory replenishment system from the retailer will not release an order for new merchandise until the vendor visits the store directly or contacts the store manager to investigate the problem and demonstrate that the product is not available for sale.  It is useful, when contacting the store manager, to know the date of the last unit sold.  This date, and the average weekly unit sales (Avg WS) calculated in Step 1, will indicate to the store manager when a sale should have occurred.  That is, if, on average, a given item is sold every other week, and 8-10 weeks have passed at a given store without a sale despite recorded inventory on hand, this is indicative of a problem, since 4-5 units should have been sold during that timeframe.

Business Rationale for Store Level Merchandising Analysis
Conducting a store level merchandising analysis can be a time consuming effort for a vendor.  Many vendors have trouble rationalizing the expense, especially vendors with very good in-stock rates.  But, even a vendor with an in-stock rate of 98.5%, still has 1.5% of stores out of stock.  In a typical 3,000 store chain, this could represent as many as 45 stores out of stock.  If those stores averaged just one unit sold per week, that translates to as many as 2,340 units of lost sales per year.  Since this represents only a single item, and out of stock stores typically are out of multiple items and average significantly more than one unit sold per week per item, this vendor is looking at hundreds of thousands, or potentially, millions of dollars of lost revenue (LR) per year, despite a very high in-stock rate of 98.5%.

Resources:   Whitepapers on SKU Sales Analysis, Store Analysis, Out of Stock Analysis and SKU Forecasting are available.  https://www.acceleratedanalytics.com/whitepapers/