The bullwhip effect is a serious problem for vendors. The article below will provide a comprehensive introduction to the problem and impact. After you finish reading the article do this exercise: calculate the total number of stores stocking your products [# of retailers * average total stores], then multiply by 2%, which is an average out of stock rate. This is the total stores that are currently out of stock on your products. Next multiply by an average weekly unit sales for your key product(s). This is your total lost sales opportunity.
Leading retailers and manufactures are dramatically improving sales and profits by embracing a new supply chain model built upon sharing point-of-sale demand data and closely collaborating on forecasts. Research conclusively demonstrates demand driven collaborative supply chain models drive more accurate forecasts, fewer out-of-stocks, higher sales, and higher operating margins.
There are many variations of demand driven collaborative models in service, the most popular of which are:
- Efficient consumer response (ECR)
- Collaborative planning, forecasting, and replenishment (CPRF® )
- Vendor managed inventory (VMI)
- Demand driven supply network (DDSN)
The overlap of these models and generally slow adoption is creating a great deal of confusion in the market. While each model is slightly different in its approach, definitions, and processes, they all have a common goal: share actual demand data with all parties in the supply chain and facilitate real-time collaboration to reduce inefficiency and improve sales.
The purpose of this article is to discuss the financial benefits of implementing a demand driven collaborative supply chain model and provide best practices for getting started.
AVOIDING THE OUCH OF THE BULLWHIP EFFECT
The basic premise of the demand driven collaborative supply chain model is that in order to achieve the highest possible in-stock and simultaneously minimize waste, all parties within the supply chain must have timely access to actual sales demand data and all parties must have a means by which they can work together to coordinate promotions and business planning.
A forecast by definition is an estimate made in advance of an event occurring and is therefore an educated guess. Unfortunately, even sophisticated forecasting software can have an error rate of 50% on promoted items. Most troubling of all, forecast accuracy decreases, moving backward into the supply chain.
The reason forecast accuracy decreases, moving backward in the supply chain, can be illustrated by plotting sales over time for supply chain participants as depicted in CHART 1. Notice the actual sales demand recorded at the retail point-of-sale has moderate variation. This is because the retailer builds their forecast model using actual demand as tracked through their point-of-sale systems. But notice how much more chaotic and unpredictable the demand curve becomes as you move away from the actual point-of-sale. Demand as viewed by the supplier, wholesaler, and manufacturer is based on estimated sales, which combined with latency and manually adjusted “safety stock”, causes increasingly inaccurate and chaotic forecasts. Research indicates a fluctuation in actual customer demand of +/-5% will be interpreted by supply chain participants as a change in demand of up to +/-40%. As depicted in Chart 1, although actual demand has only changed +/-5%, the reaction of supply chain participants is dramatically exaggerated and is known as the bullwhip effect. Much like cracking a whip, the user only needs a small motion in their wrist (point of sale) to cause a huge motion in the end of the whip (manufacturer).
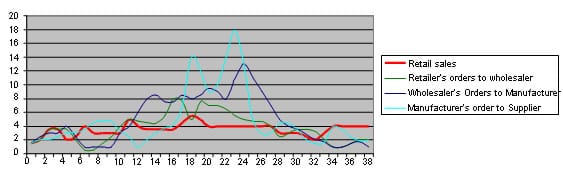
The bullwhip effect causes inaccurate forecasts, inefficiency, and waste within the supply chain. Anytime the forecast line of a supply chain participant (e.g. chart 1; wholesaler, manufacturer, or supplier) is above or below the actual demand line (e.g. chart 1; retail sales) inventory levels are not optimized and out-of-stocks or inventory build-up will occur. The U.S. Department of Commerce estimates $3 trillion in excess inventory is locked in the U.S. and European supply chains. The bullwhip effect is exacerbated by the parties within the supply chain who do not have an accurate understanding of actual demand. In other words, they are forecasting, but the inputs upon which their forecast model is built are inaccurate.
Accurate forecasting and close coordination between supply chain partners can help to eliminate the bullwhip effect and dramatically increase overall profitability. The most effective way to improve forecasting accuracy at each step in the supply chain is to base the forecast on actual sales demand data. In this way, each point in the supply chain can be demand driven and the parties can collaborate on the same forecast inputs. In addition, promotions can be coordinated and managed to maximize sell-thru without causing supply disruptions. As information quality improves, cycle times are compressed through the entire supply chain process.
FINANCIAL IMPACT OF DEMAND DRIVEN COLLABORATION
Numerous studies provide objective financial results from sharing demand data and collaboration including studies from the National Retail Federation, AMR Research, and VICS. The reason the financial benefits are so compelling is they impact both top line revenues and bottom line operating margins; and, these programs are a win-win for both the retailer and the supplier since the financial impact between the two is directly linked.
Financial Impact #1: Increase sales by 5-10%
Average retail industry out-of-stock rates average 8% and can be as much as 40% on promoted items, which results in a loss of sales between 5% and 10%. Demand driven collaborative supply chain programs drive higher sales by improving in-stock rates between 2% and 8%.
Financial Impact #2: Increase operating margins by 5-7%
Many retailers are managing in-stock performance by increasing their base replenishment levels and carrying additional “safety-stock.” While this approach offers a short-term advantage, the long-term drawbacks are obvious; higher operating costs due to slow inventory turnover and higher logistics costs. By sharing demand data, forecast accuracy is improved and less safety stock is required to keep in-stock levels at target. Less capital is tied up in inventory, improving both return on invested capital (ROIC) and gross margin return on investment (GMROI).
Demand driven collaborative programs also have a positive effect on customer brand loyalty. This is because stock-outs also cause another, even more insidious problem – 32% of consumers who can’t find an item will go to another store. If the stock-out occurs three times or more, the consumer is likely to purchase a different brand. So today, the retailer may loose the sale, but tomorrow, so may the supplier. This dynamic creates a powerful incentive to work together for accurate forecasts. As an example, by working with suppliers and closely monitoring point-of-sale data for its 1,450 fastest-selling items, H-E-B Grocery was able to reduce its out-of-stock rate by 22.5% in just eight weeks. Similarly, Sainsbury tracked its 2,000 top items and increased sales by 2%. These are powerful examples of how leading retailers are using demand data and working in concert with suppliers to dramatically improve operating results.
Related posts