Author: Chad Symens

Lowe’s is the Place to Work this Spring

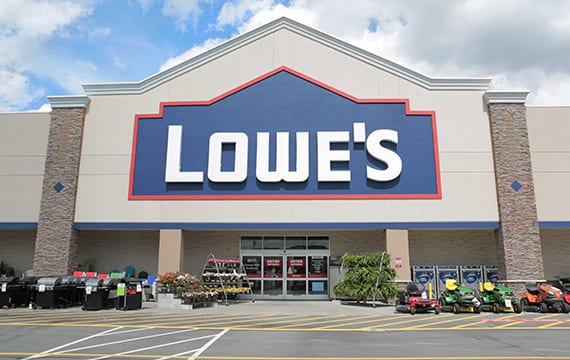
Lowe’s is gearing up for Spring, adding 53,000 full time, part time and seasonal employees to its current 250,000. Lowe's a Great Place to WorkLowe’s offers its employees a lot of benefits, even to those who are seasonal or part time in most cases. They provide a 10% employee discount, competitive wages, flex hours and the ability to see their schedule 17 days in advance in order to swap shifts if necessary. Part time and full time employees can also take advantage of their health and wellness benefits, incentive program, 401(k), stock purchase plan, and tuition reimbursement. 200 current Lowe’s store managers started as seasonal employees. Lowe’s is also known as a company that gives back. Last year, all of Lowe’s 1700 stores in the US served their communities through a Lowe’s Heroes volunteer community project. They also gave $2.5 million to disaster relief after the two major hurricanes last year. The company also offers full time employees paid time off for community service. New job openings span across the US, with the largest markets and openings being Atlanta, Boston, Charlotte, Indianapolis, Los Angeles, Raleigh-Durham and New York.

Source: Lowes.com

NRF’s Big Show Talks With Home Depot and Other Retailers About Millennial and Gen Z Engagement

Engaging the Gen Z Shopping CrowdSenior VP of Store Operations at The Home Depot, Marc Brown, joined a panel at the NRF’s Big Show this month to talk about the importance of engaging younger shoppers and the different methods they are undertaking to make that customer connection. The younger generation is particularly devoted to shopping at retailers who try to make a difference. Mr. Brown spoke about Home Depot’s long-term charity work, such as with Habitat for Humanity, helping veterans find housing and disaster relief efforts. “There’s a period of time where the business part doesn’t matter because you’ve got to get things back to normal for that community, “ he said.

With Millenials’ and Gen Zers’ heavy use of social media, this outlet is increasingly a growing part of the brand-consumer relationship. 55% of Gen Zers choose brands specifically because they are socially responsible or eco-friendly and 66% of consumers want retailers to take a stand on important political issues.

To read more on the buying behaviors of this younger generation of shoppers, check out our infographic, What Retail Needs to Know About Generation Z. Accelerated Analytics partners annually with many of its retail vendor customers to volunteer at a Habitat for Humanity build site in our home town of Sarasota, FL. You can read more about these efforts and the brands who partner with us, here.  Our customer, Kidde, also partnered with The Home Depot last Fall to distribute smoke alarms across the country.

Source: RetailDive.com

Home Depot and Lowe’s Stock Growth in Last 6 Months

With improved employment levels and the housing market booming above 2006 levels, home improvement retail stocks haveHome Depot Stock and Lowe's Stock continued to grow. The Home Depot has outpaced the S&P 500 in the last 6 months, growing 39.3% versus the home improvement retail’s gain of 37.7% and S&P 500’s increase of 13.7%. The company attributes their success to maximizing square footage initiatives in current stores versus opening new ones, and focusing on the customer experience and buy online – deliver from store capabilities. Home Depot has been reporting strong numbers for the past 5 years, with record breaking year over year comps the past two quarters.

Back in October, The Home Depot stocks were trading at $163 and Lowe’s was only at $80, but since then Lowe’s is up 29% and Home Depot is up 21%. Home Depot has more physical stores in the US, with 2283 compared to 2144 at Lowe’s. Revenues through Q3 were much higher than Lowe’s but several other factors that can affect stock are looked at. As of Q3, gross margin for Home Depot was 34.1% and Lowe’s was 34.2%. Both CEOs are accredited for strategies that provide shareholder returns while minimizing risk. While The Home Depot’s revenues overall are higher, at $77B at Q3 compared to Lowe’s $53B, the average ticket is higher at Lowe’s, at $71.60 compared to Home Depot at $63.55.

Today Home Depot stock (HD) is reporting at $204.45 and Lowe’s (LOW) at $107.11.

Sources: Nasdaq.com, Seekingalpha.com

Fragrance and Beauty are Growing the Travel Retail Industry

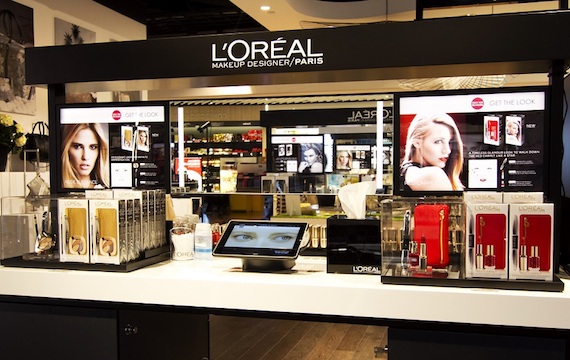
Huge growth in fragrance and beauty is the largest contributor to the travel retail market, with wines and spirits coming in Beauty Clients Growing the Travel Retail Industrysecond. The current travel retail market was valued at $69.5 billion in 2016, and is predicted to reach $125.1 billion by 2023. Within perfumes and cosmetics, Accelerated Analytics customers including Estee Lauder and L’Oreal are opening outlets at every major international airport. With an improving economy there will be increases in travel and tourism. In Europe, which is one of the largest travel retail markets with $21 billion of the sector, they are seeing a significant presence from apparel and cosmetics brands, especially from LVMH from France, which holds a large share of luxury apparel, perfumes and cosmetics in the region. Perfumes and cosmetics accounted for 30% of the travel retail market in 2016 findings and is expected to dominate the market by 2023.

Source: Chain Store Age

2018: The Year of the Retailer?

Year of the Retailer

As 2017 closed with high holiday sales results across online and brick and mortar retailers, predictions for 2018 and beyond are very positive. After years of news reports of store closings and retailer bankruptcies, 2017 had more store openings than closings and that pattern is expected to continue through 2021. A newly released study by Zebra Technologies, conducted by IHL Group, shows that 42% of retailers had a net increase in stores, while only 15% had a net decrease. The study also projects North America and Europe sales through 2021, to rise 3% annually. That equates to growth to $5.5 trillion in sales. Retailer feedback to the study about their focus indicated a continuation of what appears to be working: providing customers with engaging experiences, and increasing technology in stores to manage inventory and improve the in-store returns process after online purchasing.

Our Power Packs Go Beyond What Comes in Free Portals

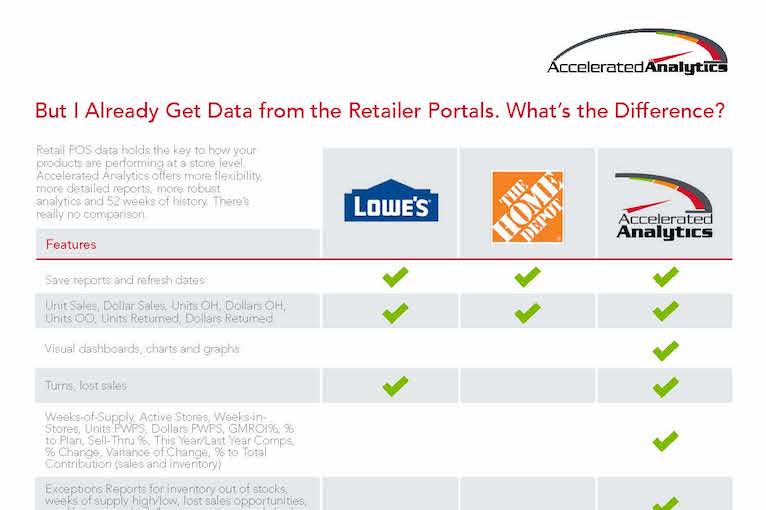
With 15 years in the DIY sales and inventory reporting business, and over 50 years of retail experience, Accelerated Analytics offers “Power Packs” of reports expertly crafted for home and hardware brands. Our reports provide instant access to key performance indicators and measures that brands need to monitor results and drive business success at The Home Depot POS Reporting Solutionsand Lowe’s. Brands are able to obtain some information directly from the retailers’ portals, so you may be asking what our consultative reports have that the free portals don’t. Easier to use, with greater flexibility and more robust data, our reports can be leveraged to improve sales comps and optimize inventory.

While brands can use the free retailer portals, the process of managing that data each week still presents challenges:

  • Extraction from each portal is manual, separate and difficult to merge into spreadsheets, and can take several days to get together, losing valuable time to take action on last week’s results
  • Retailer-specific SKUs need to be cross referenced to each other and to internal brand SKUs
  • Store information, product descriptions and attributes, comps and calendaring need manual manipulation or are not incorporated at all
  • Distribution to teams is manual, difficult and time consuming
  • Actionable insights are not readily called out, such as out of stocks or lost sales opportunities

Take a look at a side-by-side comparison of Home Depot Link, Lowe’s DART and Accelerated Analytics for more details on what our robust “Power Pack” of reports can provide!

The Top 5 Retail POS Reports in 2017

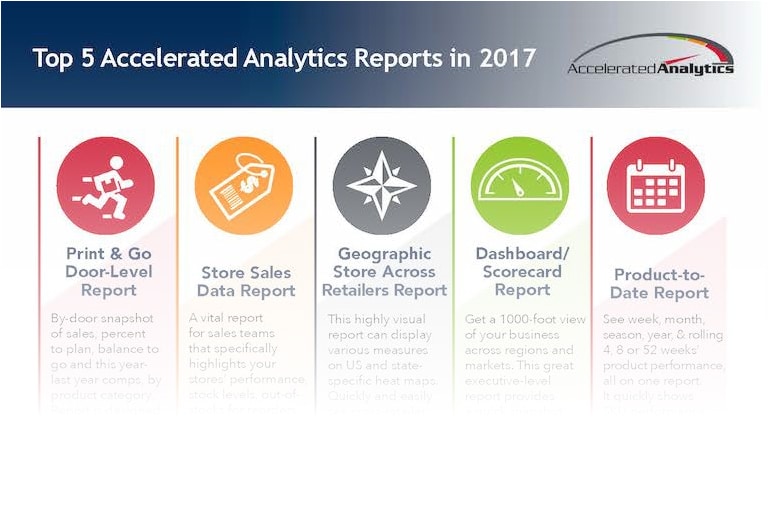
Whether they sell lighting fixtures or lip gloss, our customers understand the power of leveraging retail POS data to gain valuable insights into their business. And while the go-to reports for a planning executive for a cosmetics company might be different from the reports that a hardware store field rep relies on each day, there are five Accelerated Analytics reports that emerged as customer favorites across all brand categories in 2017:

Print & Go Door Level Report

Most often used by Beauty vendors, Print & Go Door Level Reports reveal a brand’s most important store level activity and sales results. Each page of the report is designed to reflect activity for a particular door and the report is designed so the user can quickly see results from a product category perspective. At a glance, the user can see last week’s sales, comp to last year, % to plan, and balance to get to plan. In addition to the prior week, the report shows month, season, and year to date results, as well as full prior year and current contribution to their total chain. The report displays such that each page reflects one door. This report is ideal to distribute to store managers and beauty consultants on the selling floor so they can direct sales and inventory to meet and exceed plan goals.

Store Sales Data Report

In addition to specific sales and inventory levels at each store, the Store Sales Data Report shows the number of active stores, weeks selling in stores, sell through, sales-to-stock ratios, weeks-of-supply and turn. With flexible date ranges, this report is a great snapshot of store performance with this year/last year comps. Online sales are also represented as a “store” in the report. The report helps identify top and bottom performing stores and their contribution to total sales within a retailer. Cross-retailer views also allow for competitive analysis for stores that are in the same geographical area.

Geographic Store Across Retailers Report

Because your data is multi-retailer, you can look at product level performance across geography and across retailers. Where is your customer buying? What is your customer buying? What sells better at each retailer? How did your product launch or promotion go? What is your product inventory spread across retailers? This report is critical to gain a better internal analysis of your business.

Dashboard/Scorecard Report

Dashboards and scorecard reports quickly identify units and dollars sales metrics, as well as top and bottom performing products and stores. The report can be run from a total corporate, retailer-specific and store-specific view, as well as blend cross-retailer information to identify performance across your key accounts.

Product-to-Date Report

In addition to the basics, the Product-to-Date Report shows sales-to-stock ratios and weeks-of-supply with on-hand and on-order inventory levels. In-stock percentages, turns and average units and dollars are also displayed.

Infographic: Top 5 Reports of 2017

Request and download our infographic detailing the benefits of each of our top 5 reports:

Christmas Cheer Felt by Retailers This Holiday Season

Retailers Christmas Joy

With consumer confidence currently at a 17-year high (as reported in our Retail Industry Briefing Book) it makes sense that holiday retail sales in the U.S. rose at their best pace since 2011, according to Mastercard SpendingPulse, which tracks both online and in-store spending. Excluding automobiles, sales rose 4.9% from Nov. 1 through Christmas Eve, compared with a 3.7% gain in the same period last year.

“It started with a bang in the week leading up to Black Friday,” said Sarah Quinlan, a senior vice president of marketing insights at Mastercard. She added that retailers benefited this year from Christmas Day falling on a Monday, giving shoppers a full weekend to scoop up last-minute purchases. Dec. 23 ranked next to Black Friday in terms of spending, according to Mastercard.

“Overall, this year was a big win for retail,” Ms. Quinlan said.

Retailers are breathing a sigh of relief. From department-store giants like Macy’s to mall favorites like The Gap, brick and mortar retail struggled through a difficult year of store closures.

In past years spending was driven by high-income shoppers, but this year there is a lot more spending from the lower- and middle-income groups due to rising wages and low unemployment.

Source: Wall Street Journal

The 12 Days of Christmas with Accelerated Analytics

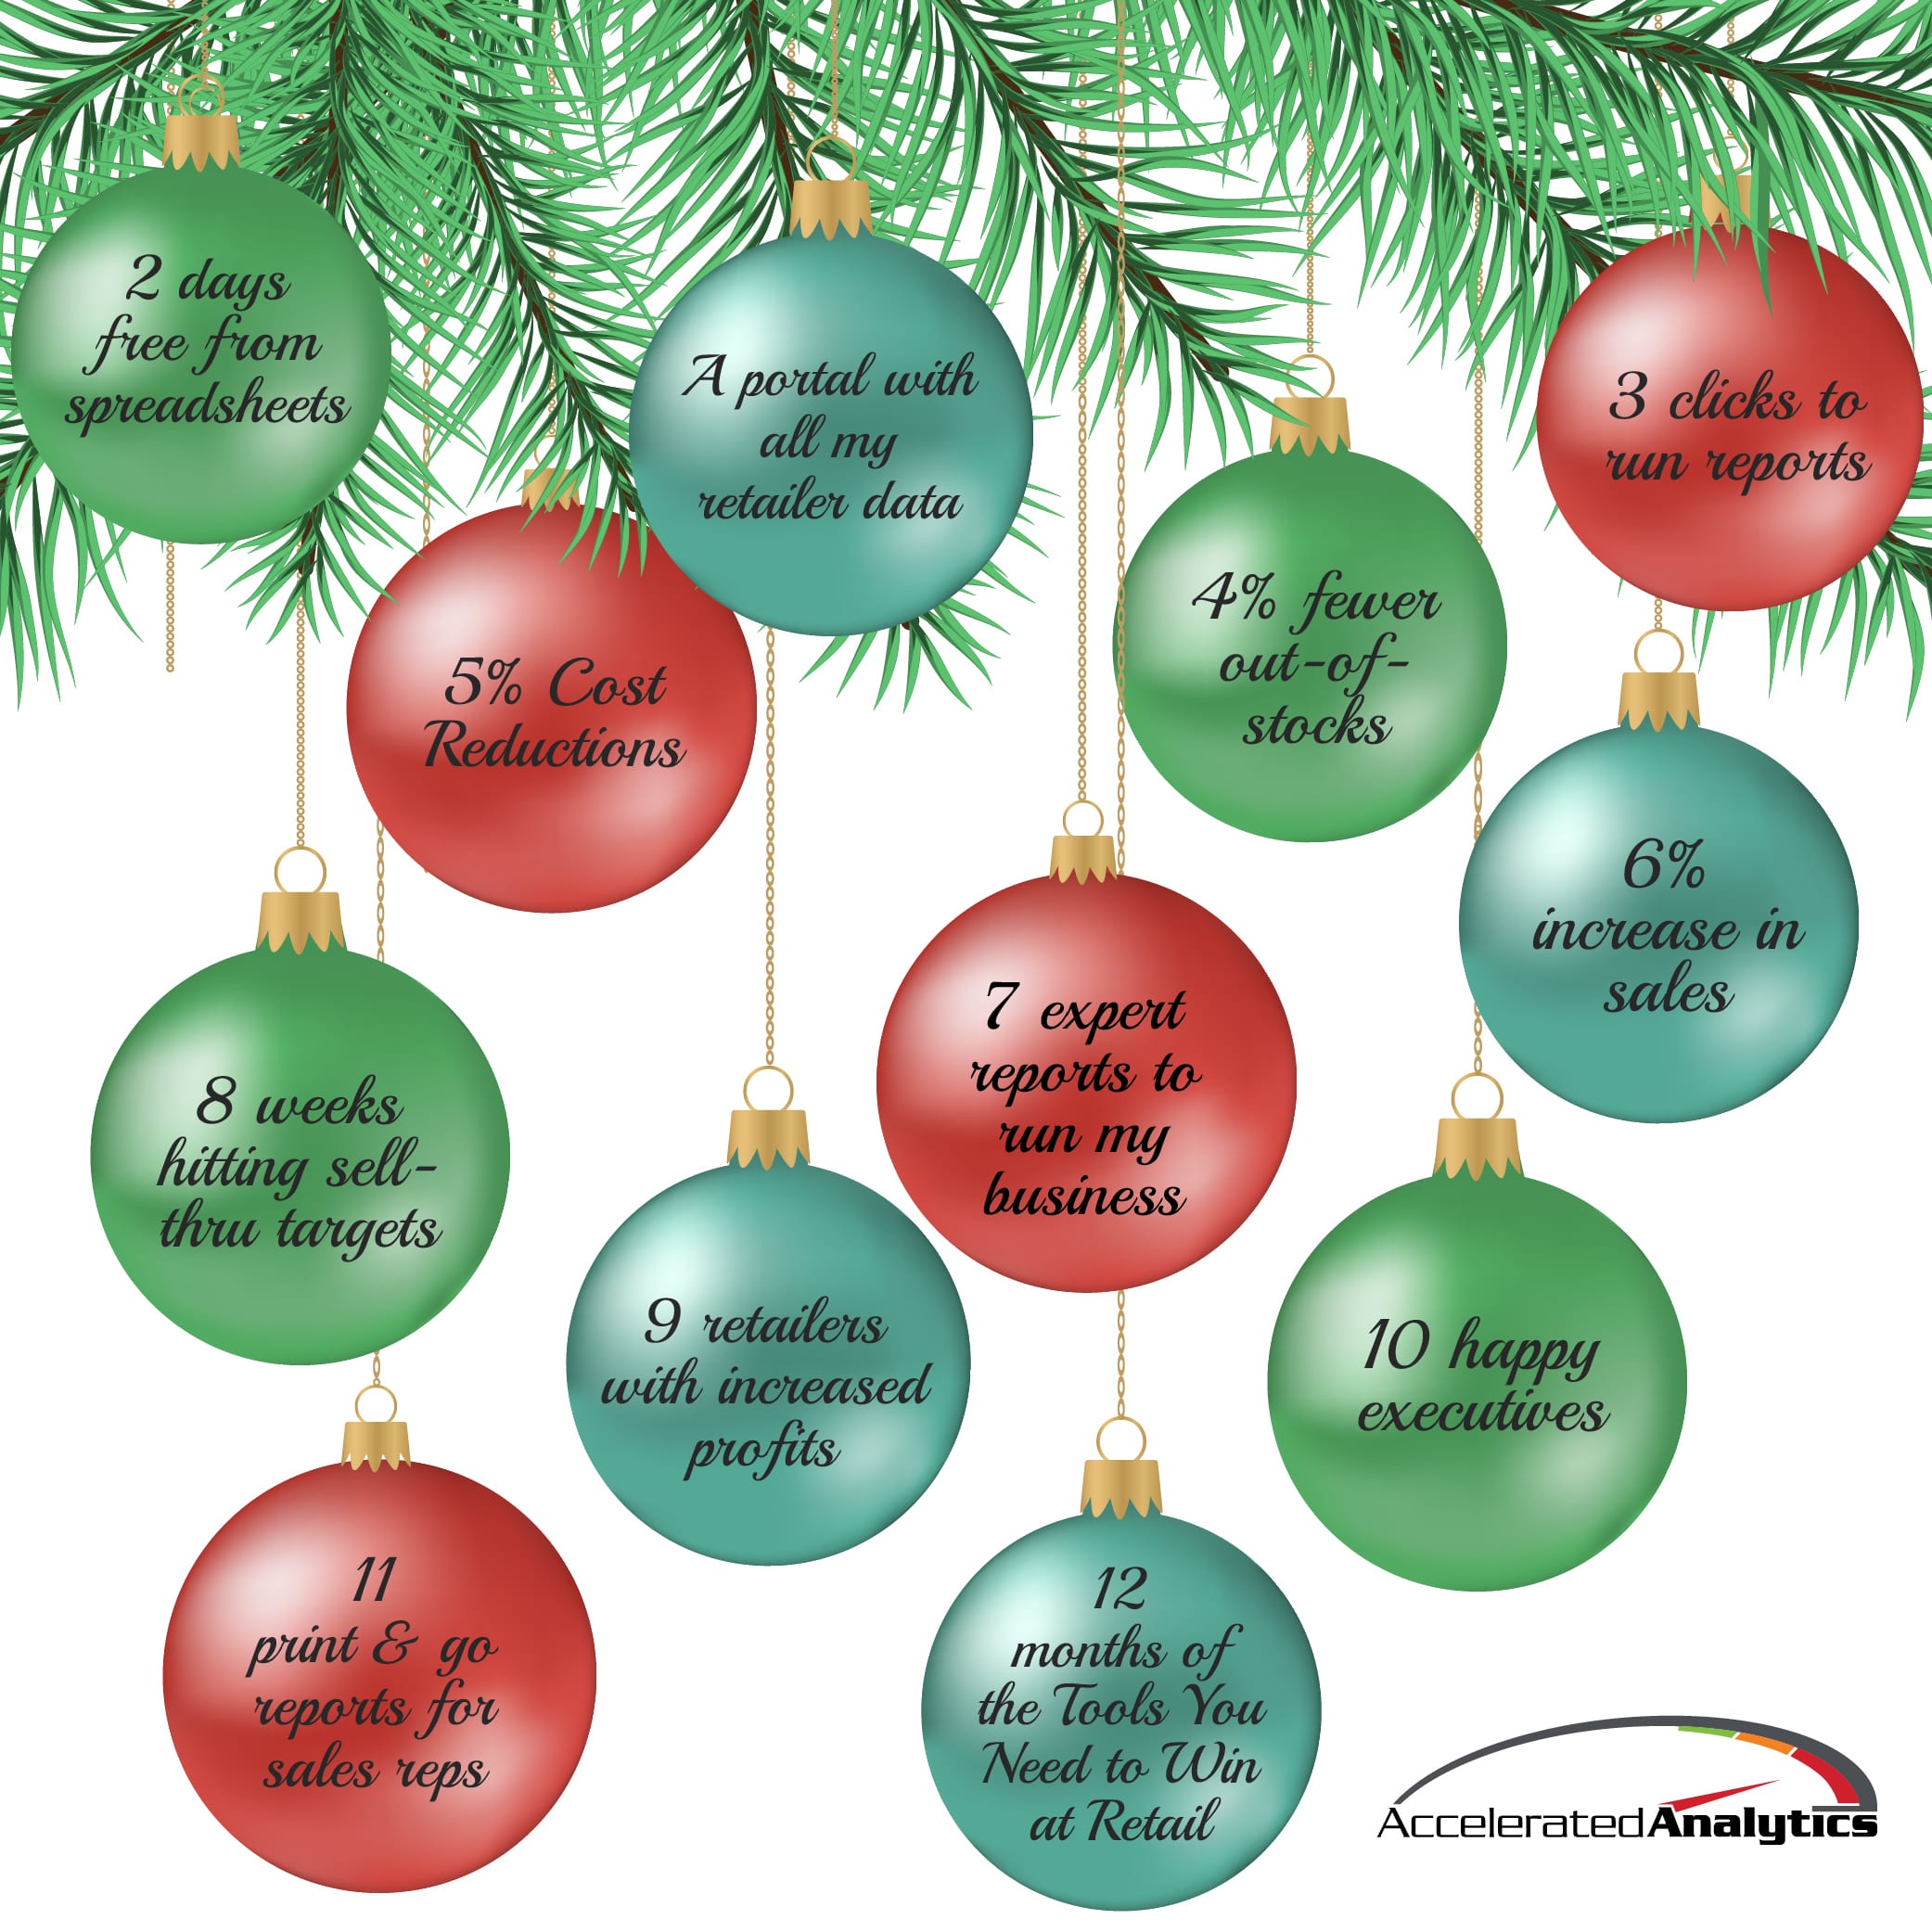
On the first day of Christmas, Accelerated gave to me, a portal with all my retail data!

On the second day of Christmas Accelerated gave to me, 2 days free from spreadsheets,

On the third day of Christmas Accelerated gave to me, 3 clicks to run reports,

On the fourth day of Christmas Accelerated gave to me, 4% fewer out-of-stocks,

On the fifth day of Christmas Accelerated gave to me, 5% cost reductions

On the sixth day of Christmas Accelerated gave to me, 6% increase in sales,

On the seventh day of Christmas Accelerated gave to me, 7 expert reports to run my business

On the eighth day of Christmas Accelerated gave to me, 8 weeks hitting sell-thru targets,

On the ninth day of Christmas Accelerated gave to me, 9 retailers with increased profits,

On the tenth day of Christmas Accelerated gave to me, 10 happy executives,

On the eleventh day of Christmas Accelerated gave to me, 11 print & go reports for sales reps,

On the twelve day of Christmas Accelerated gave to me, 12 months of the Tools You Need to Win at Retail!

Get expert reporting tools for your company for the holidays this year and you’ll be singing these results next December!

POS Reporting Tools Being Used by Luxury Brands

POS Reporting Tools

Luxury brands are constantly struggling with department stores’ need to markdown their merchandise, which hurts the prestige and high value of their brand. Over this Christmas season, brands such as Ralph Lauren, Michael Kors and Kate Spade are watching sales and inventory levels very closely each week. When possible, retailers are even monitoring daily, looking at sell-through percentages to determine if they need to mark products down to keep sales-to-stock ratios balanced. Customer buying trends of ordering online and returning the item to a brick and mortar store exacerbates the problem. Brands needs to be on top of the data to try to make recommendations that don’t result in retailers marking their merchandise down. The trick at the end of the holiday season is not to sell the most, but to end up with the least amount of unsold merchandise going into January. Using POS data and staying informed about where their merchandise is at all times helps brands alleviate the need to buy more than they need, “just in case”.

Source: businessoffashion.com