Author: Web Dev Team

Insights from Beauty Brands Working with Ulta and Sephora

Why Out-of-stocks, Data Mismatch, and Hidden Demand Still Catch Out Beauty Brands

When beauty brands review retail performance, the picture often looks reassuring.

Availability appears high. Sales reports feel complete. Forecasts are built on what was sold.

But our conversations with brands working directly with Ulta and Sephora reveal a more complicated reality. One where missed sales rarely show up in reporting, availability data doesn’t always reflect what is happening on the shelf, and demand signals are quietly distorted long before anyone realises.

This article brings together first-hand insight shared by operators working inside major beauty retailers and explains why these blind spots matter commercially for brands selling through Ulta, Sephora, and similar retail partners.

What Operators See When Products Go Out of Stock

In a recent webinar panel with business leaders selling via the Ulta ecosystem, one issue comes up repeatedly: when a product is unavailable in store, the commercial impact goes far beyond a temporary dip in sales.

As Caroline Chong explains during an Ulta performance webinar:


×

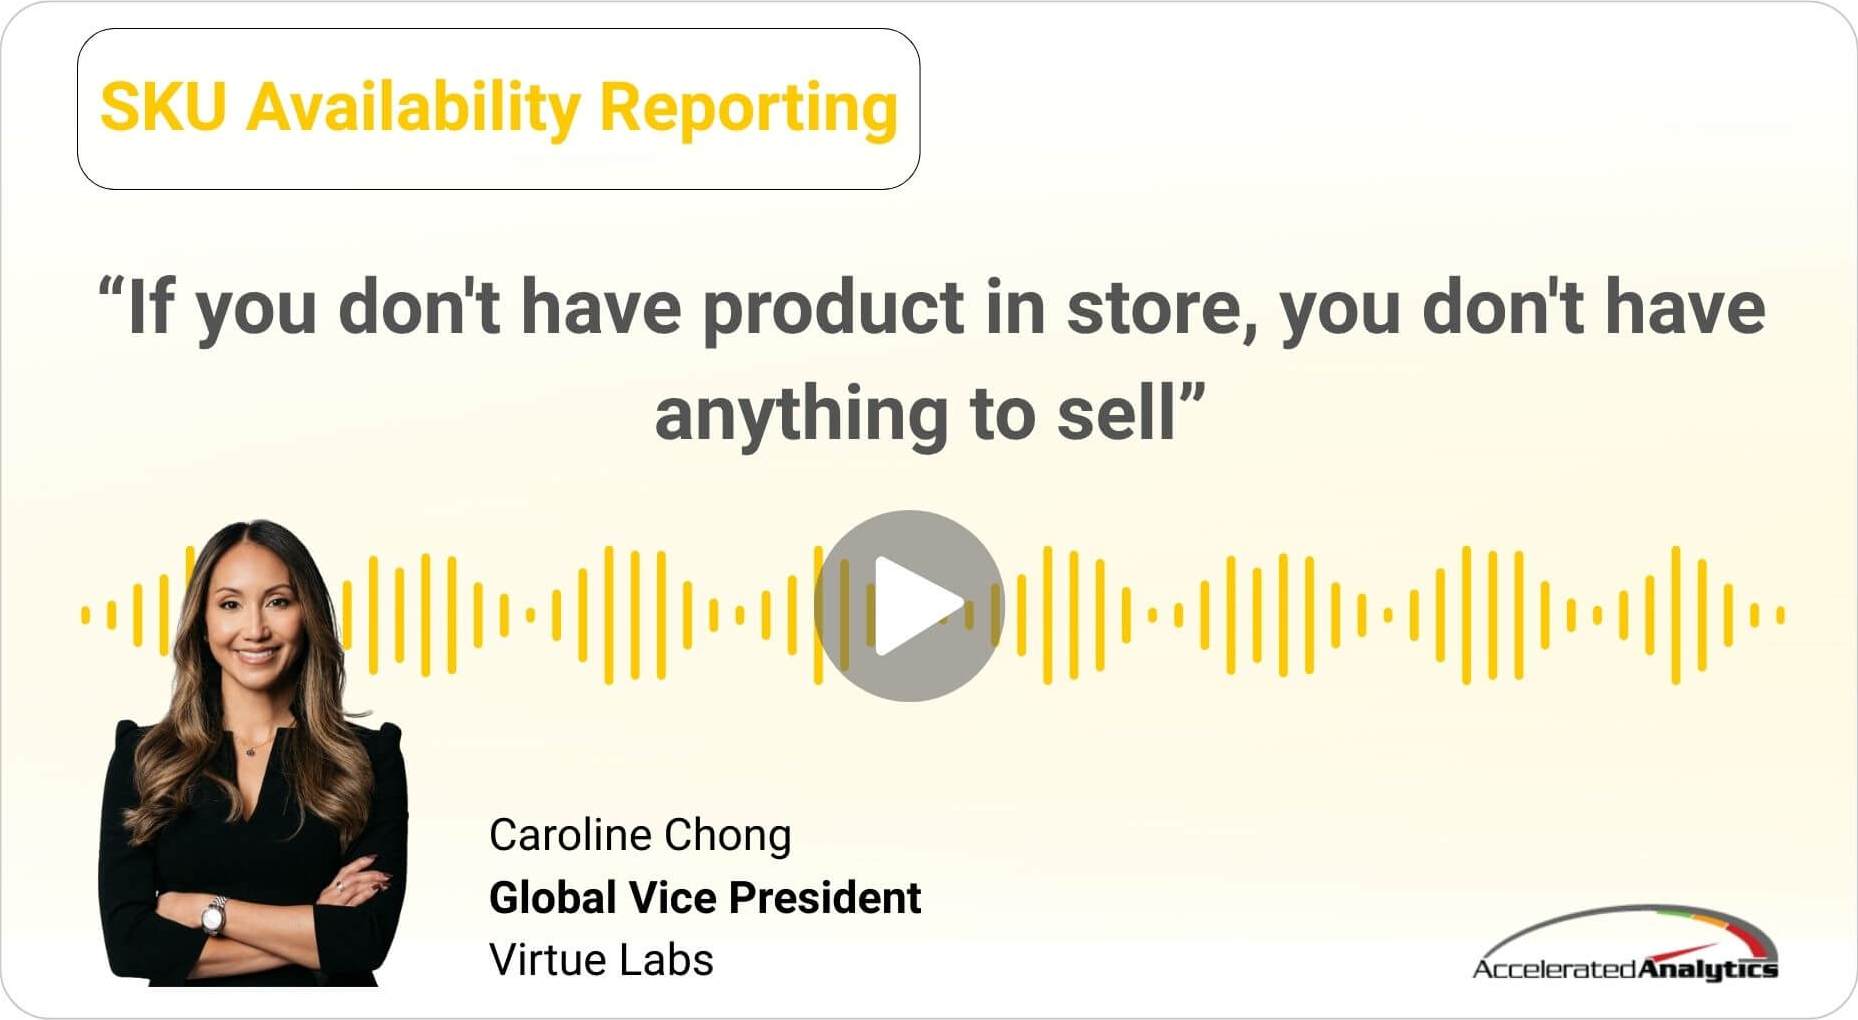
“If you don’t have product in store, you don’t have anything to sell, anything to convert. And then obviously you’ve limited yourself in terms of your future potential with Ulta and the partnership. So we do not want to leave any sales on the table as a brand, but also Ulta does not want us to leave any sales on the table.”

Caroline Chong Global Vice President Virtue Labs

What makes this especially challenging is that those lost opportunities rarely appear as a visible problem. The sales that could have happened during an out-of-stock period are never recorded, which means the underlying demand signal disappears entirely.

For beauty brands, this has knock-on effects. Forecasts inherit incomplete data. Replenishment decisions are based on what sold, not what could have sold. And by the time inventory returns, the opportunity window may already have passed.

Why Availability Metrics Can Create False Confidence

Availability is often reported as a single percentage, typically calculated using SKU counts or inventory value. On paper, those figures can look healthy, and why wouldn’t 98% availability look reassuring.

But as brand leaders working with Ulta frequently point out, those metrics do not always reflect store-level reality.

“What they have in their system is not realistic in terms of what’s actually happening in the store. Many times it’s very mismatched, and until you get that right, you’re not actually getting the right flow of goods.”

Caroline Chong Global Vice President Virtue Labs

This mismatch creates a false sense of confidence. A brand can appear 97–98% available overall while still missing meaningful revenue in high-velocity stores or on key SKUs. When availability metrics mask these gaps, corrective action tends to come late. By the time the issue surfaces in sales data, the lost demand has already gone unmeasured.

Addressing this typically requires reconciling store and SKU-level signals into a single operational view, rather than relying on aggregated retailer reports, an approach outlined in this beauty brands analytics overview.

Hidden Demand Signals Start Appearing When Retail Data Is Analysed Together

Most brands analyse retail data partner by partner.

But when datasets from retailers like Sephora, Ulta, Target and department stores are analysed together, patterns begin to emerge that traditional reporting structures rarely reveal.

These often include:

  • Recurring stock-out cycles across retailers
  • SKUs where demand exceeds shelf availability
  • Regional demand signals masked by aggregated reporting
  • Revenue lost due to constrained inventory

Accelerated Analytics was designed to uncover these patterns by harmonising fragmented retail datasets into a single analytical environment.

See how the platform identifies hidden demand signals

Book a short walkthrough →

Why Store- and SKU-Level Visibility Changes Decisions

What differentiates brands that can act quickly from those that cannot, isn’t simply access to more reports, but access to usable, granular visibility SKU and Store level data.

From first-hand experience working with Ulta, Chong describes how decisions change once teams move beyond aggregated reporting:

“We actually go store by store, SKU by SKU to see what’s on hand and provide that by-door report to our inventory management team and merchant team on a weekly basis, to make sure we’re not missing out on anything.”

Caroline Chong Global Vice President Virtue Labs This level of insight shifts conversations with retail partners. Instead of debating whether a problem exists, teams can focus on where action is required and how to protect revenue while the opportunity still exists.

A recent example of this shift in practice can be seen in the Bubble Skincare case study, where fragmented retail signals were consolidated to improve visibility and decision-making.

From Suspicion to Measurement: Making the Problem Visible

Across discussions with teams selling through Ulta and Sephora, the same pattern emerges. Brands often suspect they are missing opportunities but lack the visibility to quantify the impact.

During a Sephora strategy discussion, Holly Basher highlighted how timing plays a critical role:

“Having the data upfront really allows you to work instantaneously instead of dragging out and waiting for the data. So, you’re able to be in the moment and be proactive versus reactive.”

Holly Bashor

Senior Director of Sales and Education

Helen of Troy

Once brands begin reconstructing demand using store-level and SKU-level signals, the conversation changes. The question is no longer whether opportunity exists, but how much demand has been going unseen and what that means for forecasting, launches, and future growth.

This is typically the point where platforms like Accelerated Analytics are introduced, not as a reporting layer, but as a way to normalise fragmented retail data and surface signals that traditional reporting structures miss.

A practical overview of how this consolidation works across retailers like Ulta and Sephora can be seen on the beauty brands retail analytics page.

What This Means for Beauty Brands

For beauty brands selling through major retailers, these challenges are rarely isolated. They influence launch performance, replenishment decisions, retailer relationships, and long-term planning.

When missed demand remains invisible, businesses optimise around an incomplete picture and revenue leakage becomes systemic rather than incidental.

See How Beauty Brands Identify Lost Revenue from Stockouts

Brands working with retailers like Sephora, Ulta and Target often discover that reported demand understates true market demand.

By analysing retail sales patterns alongside inventory availability, it becomes possible to identify:

  • Where stockouts suppressed demand
  • Which SKUs consistently sell out after replenishment
  • Which doors are under-allocated inventory
  • How much revenue is being missed

Accelerated Analytics helps brands uncover these patterns by harmonising fragmented retail data across partners.

See how this works using real retail datasets.

Book a short walkthrough →

The Lost Revenue That Isn’t Shown in Your Retail Reports

For the vast majority of beauty brands selling through retailers like Sephora, Ulta, Target, Boots, or national department stores, demand is inferred from sell-through data. Daily sales, promotional uplift, and store performance reports are treated as reliable indicators of what the market wants.

However, this can be misleading as these numbers only show what could be sold, not what should have been sold.

When a SKU is out of stock in a store, demand does not queue up waiting to be recorded later, it’s simply lost. Shoppers substitute, delay, or abandon the purchase entirely. In that moment, every potential sale that could have been made or recorded simply disappears and doesn’t get logged as a data point.

  • No lost sales get logged.
  • No signal is fed back into planning.
  • No record exists that demand ever occurred.

For brands selling through retail distribution, this creates a structural issue: you are planning future inventory based on demand figures that are understated.

Why Out-of-Stocks Distort Forecasting Long After Inventory Returns

Out-of-stocks (OOS) are typically treated as temporary planning issues, something that gets resolved once the inventory is replenished. However, in reality, the impact of OOS can be felt long after stock returns to store shelves.

When a SKU goes out of stock:

  1. Sales velocity drops immediately, not because demand has weakened, but because there’s nothing on the shelves to be sold.
  2. Forecasting models then project forward using artificially low sales data as the true demand signal.
  3. Future orders are placed based on understated market demand, perpetuating the original stock shortfall

When stock finally gets replenished, it often sells through again at pace. But it’s already too late, the next forecasting, production and replenishment cycle is already underway.

In many wholesale and retail supply chains, the time between identifying an issue, adjusting forecasts, placing orders, and receiving inventory can easily exceed 60–90 days. During that period, the business continues to project demand using incomplete demand data.

This creates a recurring loop:

  1. In store consumer demand exceeds supply on shelves
  2. Forecast data is understated versus true market demand
  3. Supply chain is blindsided, and usually responds too slowly to backfill
  4. In store stockouts repeat
  5. True market demand remains invisible and sales are missed

Over time, brands don’t just miss individual sales, they systematically under-plan for products that the market is repeatedly telling them it wants. Along with lost sales, there’s also a diminishing reputation for being a reliable retail partner.

Comfort in False Availability Metrics

Your brand might report “98% availability” across your retail network. On the surface, this suggests inventory is largely under control and puts smiles on executives’ faces.

But if you peel back the surface layer, you might find that your availability metrics are only as meaningful as the assumptions behind them. Let me explain…

Generally speaking availability is commonly measured in one of a few ways: the percentage of SKUs technically in stock, or inventory as a percentage of sales demand available across stores. Both can look healthy while masking significant commercial risk.

For example, a brand may have strong availability across slower-moving SKUs while repeatedly running out of a small number of high-velocity, high-margin products. From a reporting perspective, availability remains high. From a revenue perspective, demand is being missed where it matters most.

More importantly, these metrics rarely consider when and where demand occurs.

A product that is available for most of the week but out of stock during peak shopping periods, promotional windows, or high-traffic days is often treated as “available” in aggregated reporting. Yet from the customer’s point of view, it was unavailable at the exact moment they wanted to buy.

This is where inadequate availability reporting stops being reassuring and starts becoming misleading.

The real risk is not just that missed sales go unnoticed, but that teams make confident planning and allocation decisions based on incomplete signals. Stockouts are deprioritised, forecast corrections are delayed, and the same gaps repeat cycle after cycle.

Brands that move beyond this trap, shift the question they ask. Instead of “Was the SKU technically in stock?”, they ask “Was the full market demand actually served?”

Linking availability to demand, at store and SKU level, is what turns availability from a static percentage into a commercial insight. It’s also where the scale of revenue leakage becomes visible, and where the case for a more sophisticated analytical approach becomes unavoidable.

The Hidden Commercial Impact of Out-of-Stocks

Because lost demand is never explicitly recorded as a data point, its commercial impact tends to surface indirectly rather than as a clear metric.

Brands often experience:

  • Promotions that underperform expectations
  • Store or door-level performance that appears inconsistent
  • Categories that plateau despite strong consumer interest

First-hand perspectives from beauty operators working directly with Ulta and Sephora provide additional context on how these availability distortions surface in practice, as outlined in this article How Beauty Brands Identify Lost Revenue Caused by Out of Stocks.

At a global level, industry research has consistently shown that out-of-stocks can cost retailers and brands several percentage points of revenue annually, with estimates often ranging between 2–4% of sales, depending on category and substitutability. In beauty where brand loyalty, shade matching, and routine repurchase are common, the cost can be materially higher when customers are unable to find the exact product they want and substitute or replacement products can’t fill the void.

Even modest improvements matter.

For a brand doing $1m in wholesale revenue, even a small increase in effective availability can represent tens of thousands of dollars in recovered sales without increasing demand or marketing spend.

One example of this shift in practice is outlined in our Bubble Skincare case study, where retail data consolidation improved visibility into constrained demand.

Reconstructing True Demand in a Retail Environment

Brands that address revenue leakage don’t start by consolidating more spreadsheet reports or chasing incremental reporting improvements.

They start by reframing the question.

Instead of asking, “What did we sell?”, they ask:

“What would we have sold if inventory had been consistently available?”

Answering that requires:

  • Analysing sales patterns before, during, and after stockouts
  • Identifying unconstrained demand at store and SKU level, not just in aggregate
  • Separating genuine shifts in consumer behaviour from availability-driven distortions

When this insight is fed back into planning, it allows the brands to:

  • Correct demand signals earlier
  • Allocate inventory more effectively across doors
  • Reduce repeated stockouts in high-impact SKUs
  • Improve conversations with retail partners using evidence rather than assumptions

This is where Accelerated Analytics is typically used, as a method of harmonizing fragmented retail data across partners like Sephora, Ulta, and Target, and restoring visibility into demand that traditional reporting structures fail to capture.

A practical overview of how this consolidation works across retail partners can be seen in the beauty brand retail analytics overview.

Ask Yourself

As you reflect on your own business, it’s worth considering:

  • How many sales were lost when a product was out of stock and lost demand was never recorded?
  • Which SKUs consistently sell out shortly after replenishment?
  • How long does it take for planning and supply chain adjustments to take effect once an issue is identified?
  • What would a 1.0% improvement in true availability mean in revenue terms for your brand?

Without visibility into true market demand, these questions are difficult to answer with confidence. With a reliable analytics tool, they become accessible, measurable, and more important actionable.

See How Accelerated Analytics Reveals Hidden Demand Signals

Retail sales reports tell you what has already happened.

But the most valuable insight often comes from understanding the demand signals behind those outcomes.

When retail datasets from multiple partners are analysed together, patterns begin to emerge that traditional reporting structures often hide. These can include recurring stock-out patterns, regional demand differences, and products whose performance is constrained by availability rather than lack of demand.

Accelerated Analytics helps brands reconstruct this broader demand picture by bringing retail datasets together into a unified analytical environment.

This allows commercial teams to:

  • Identify hidden demand signals across retailers
  • Detect emerging product demand earlier
  • Understand how availability affects sales performance
  • Uncover revenue opportunities masked by fragmented reporting

If you would like to see how this works in practice, we can walk through how the platform identifies demand patterns across retail datasets.

This approach is already used by brands operating across retailers such as Sephora, Ulta, and Target to better understand demand behaviour beyond traditional retail reporting.

——————————————————————————————————————

See how Accelerated Analytics works

Book a short demo walkthrough of how the platform reconstructs demand signals across retail datasets.