What is an out of stock?
A retail out of stock is when the inventory available on the shelf is either zero, or depending on the product category, when the inventory available for sale is less than the typical job lot quantity. Conceptually an out of stock is not difficult to understand and therefore one might assume it would be fairly easy to monitor inventory and avoid an out of stock. In reality however, out of stocks average 8% and much higher on promoted items.
Why are out of stocks important?
Out of stocks are important for two reasons: (1) lost sales and (2) lost customers. If your product is not available the obvious result is lost revenue. We recently studied the average out of stock for two customers for a 52 week period and found a clothing manufacture of basics averages $1,669 per week in lost dollars sold at a major department store. A consumer products company we studied averages $1,835 per week in lost dollars sold at a major DIY retailer. Neither of these figures may raise any alarm bells on a week to week basis; however when you total the lost dollars due to out of stocks for a full year, the loss is 7.5% and 8.2% of sales respectively. In a retail environment where low single digit comp store growth is typical, increasing sales 7% to 8% based on simply managing inventory better has the potential to make a large impact. Even more compelling, these figures are for one of the many retailers these brands work with so the opportunity can be multiplied several times. The bottom line: Out of Stock stores are costing your business a significant amount of sales. The second impact of out of stocks is lost customers. Studies show a consumer confronted with an out of stock product will substitute for another product at the same store. What if that consumer decides the other product is the same or even better quality than your product? Will they purchase your product the next time they are in the store or will they stick with the substitution? A simple out of stock could cost you a customer and the repeat sales you might have otherwise enjoyed.
Fixing Stock Out of Stock Issues
A multistep process is required to fix out of stock issues and increase sales. The steps in the process are outlined in Figure 1 below.
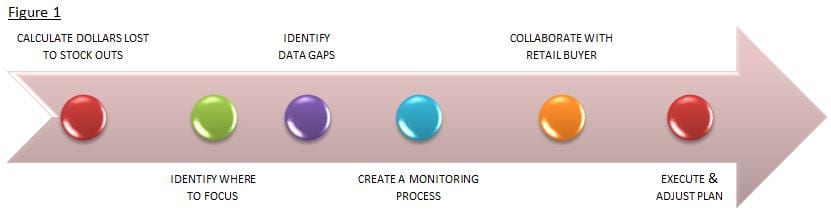
Calculate Dollars Lost to Stock Outs
Change in any organization rarely occurs until there is a financial incentive to invest in a solution. In order to motivate the manufacturer and the retailer to invest into solving out of stock issues we recommend starting by calculating the dollars lost to stock outs. The initial benchmarking can be accomplished through a fairly straightforward process. An example is provided in Figure 2 below. The analysis will require either four or eight weeks of sales in units and dollars, ending units on hand, and the unit retail price. The decision to use four or eight weeks of sales for the analysis depends on the rate of sale of the products being analyzed. If the products are fast moving, four weeks of sales should be sufficient, if the products are slow moving eight weeks of sales will yield a more accurate result. The example below includes sales for both periods. The data should be at UPC/SKU and store grain. In order to identify the out of stock issues driving lost sales two filters should be applied to the data. First, a minimum sales activity filter should be applied to make the estimate as conservative as possible. A good rule of thumb is to apply a filter requiring an average of one unit sold per week over the period. If your products have a high rate of sale then you can increase the average. The second filter is used to limit the data to rows with OH = 0. After applying the filters calculate the average weekly units sold over the sales period you selected. E.g. total units sold / count of weeks. The average weekly units sold is used for calculating the lost dollars sold since we are assuming in this example the store would have sold that number of units had it not been out of stock. To calculate the estimated lost dollars sold multiple the average weekly units sold by the unit price.

Although the analysis is fairly straightforward it has proven to be a reliable benchmark for quantifying the dollars lost on out of stocks. Keep in mind in our example the lost dollars is for one week but it is often more compelling to repeat the analysis for additional weeks so a trend can be established.
Identify Where to Focus
The next step in the process to fix out of stock issues is to review the lost dollars sold report and identify where to focus for the largest potential impact. A good starting point is to sum the lost dollars by store and then analyze the stores on a percent contribution to the total lost dollars sold. This will help to identify stores which are having the largest inventory issues. You can also sum the lost dollars by item to identify which items are having the largest impact on out of stocks. As you study the results look to see if there is a pattern to the lost dollars. Is there a group of stores or items which are having a disproportionate impact on lost dollars? If specific items are having a large impact on the total lost dollars this many indicate a fill rate problem or a promotion which created unexpected demand. This should be further analyzed to ensure the root cause is identified. The goal is to identify a subset of stores and/or SKU’s which are having a disproportionate impact on out of stocks. Our experience shows retailers prefer to trouble shoot problems and develop new processes using a subset of stores and SKU’s for a pilot before agreeing to a broader adoption. As we move forward in the process we will use this subset to craft the plan to improve inventory management and sales.
Identify Data Gaps
A common problem encountered with managing out of stocks is a gap in the data available from the retailer. The most common two gaps are the lack of units on order and week grain data instead of daily data. Units on order are a very important data point as you move forward to creating a process to manage inventory more effectively. When you have identified an out of stock, or an item that has less than the desired weeks of supply, the next question you need to answer is does the retailer know about the issue and have they placed an order. If the answer is yes, then you simply need to ensure the order size is sufficient and then continue to monitor the on hand to ensure the inventory has been placed on the shelf. If the answer is no, then you will need to work with the buyer to suggest an order quantity which will fix the issue. The second gap in data for managing out of stocks is week grain instead of day grain data. Week grain data provides a week ending sales and on hand value which means the out of stock could have been impacting sales for several days before you even receive the data. When you add the time it takes to recommend an order and ship the product the problem only gets worse. Some retailers have the ability to transmit daily sales and inventory which will greatly improve the visibility and ability to react quickly to an out of stock. If your retailer does not provide units on order and daily data you should explore the benefits of closing these gaps with them. The lost dollars sold report created earlier in the process is a good tool to put a financial impact on the table for discussion.
Create a Monitoring Process
Creating a process to monitor inventory proactively is critical to reducing out of stocks. All good processes need tools, and in this case the essential tool is an out of stock monitoring report. An example can be seen in Figure 3. The out of stock monitoring report should include the ending on hand units and inventory weeks of supply. The OH value can be used to identify out of stocks which require immediate attention. The inventory weeks of supply can assist in getting out in front of a stock out before it occurs. We add a column for minimum inventory quantity on hand so that each individual store and SKU can be set uniquely if desired. If that level of detail is not required you can simply fill the minimum quantity on hand at a SKU level across the board. The minimum quantity on hand value should take into consideration the lead time necessary to process a new order and ship the product as well as job lot quantity if that applies to your business. The recommended order quantity then is simply a function of minimum quantity OH – current OH. If the inventory weeks of supply is below the total time it takes to process and ship an order to the store that indicates a possible future out of stock which should be addressed before it becomes an issue. After the out of stock monitoring report is ready for use the organization should identify who will run the report, the day and time the report will be run, and the specific actions to be taken based on the report findings. The actions should be arrived at based on a conversation with the retail buyer.

Collaborate with the Retail Buyer
There is very little benefit in creating out of stock reports and monitoring processes if the buyer is unwilling to accept and process a recommended order. Some buyers are quite happy to collaborate with a vendor to better manage inventory. However, our experience indicates buyers frequently need some convincing, and may even need to get buy-in from other people on their team, in order to collaborate with a vendor on inventory management. This is where the tools which have been developed will be useful. Create a business plan which starts with the lost dollars sold for a 13 to 26 week period as a way to highlight the financial impact of out of stocks. Add a discussion on the long term impact stock outs may have on product substitution and possibly even causing the customer to shop at a competitor. Use the subset of stores and/or SKU’s identified in the first step in our process to recommend a limited pilot for active inventory monitoring and include a detailed explanation of the tools and processes which will be used to manage the pilot and make order recommendations. Include a forecast estimating the increase in sales which can be expected to result from the pilot by referencing the lost dollars sold report created earlier. Be conservative with the forecast and propose that 70%-80% of the lost dollars on the report may be capture in new sales. Work with the buyer to understand the steps involved in processing a recommended order as well as the people who are involved in the process and any deadlines which may impact the plan. If there were gaps in the data as discussed earlier in this article have a discussion with the retailer about closing those gaps through a more rich set of data sent on a daily basis. Finally, agree on the duration of the pilot, how the performance will be measured and what the rollout plan will look like after the pilot is successfully completed.
Execute and Adjust the Plan
The tools for proactively monitoring out of stocks are now in place and you have an agreement with the buyer for a pilot. Now it’s time to execute the plan. Up to this point the planning process may have been directed primarily by the sales and account management team. It’s important to connect with your production and supply chain teams to inform them about new orders that will be coming which are above the historical rate of sale. After all, if the pilot goes as planned and sales are increased by several percentage points, you will need to ensure there is sufficient inventory ready to ship to keep your fill rate high. We have seen many pilots successfully identify retail stock outs and retail orders placed only to be short shipped due to lack of inventory.
Conclusion
Addressing retail out of stocks has the potential to increase sales by several percentage points. The data analysis is manageable with the right tools in place and the benefits will accrue to both the retailer and the manufacturer. It’s a classic win-win. If you would like to explore how Accelerated Analytics can help your company address retail out of stocks simply complete our information request form.

 During November and December’s uncharacteristically warm weather, Macy’s same-store sales declined 4.7%. “The holiday selling season was challenging, as experienced throughout 2015 by much of the retailing industry,” said Macy’s chairman and CEO Terry Lundgren. “In the November/December period, we were particularly disadvantaged by the historically warm weather in northern climate zones where both Macy’s and Bloomingdale’s are especially well-represented. About 80% of our company’s year-over-year declines in comparable sales can be attributed to shortfalls in cold-weather goods such as coats, sweaters, boots, hats, gloves and scarves. We also continued to feel the impact of lower spending by international tourists as the value of the dollar remained strong.”
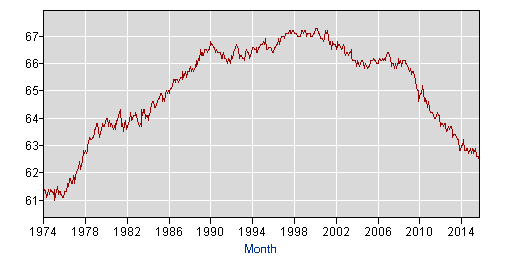 Mark Twain famously said, “get your facts first, then you can distort them as you please.” As data analyst we have a responsibility to provide an accurate and complete picture when we poor through numbers and create reports. The labor report released on Friday provides a great example of an incomplete reporting of the facts.