

- Sort
- All
- Whitepapers
- Infographics
- Industry Research
- Videos
- Case Studies
- Webinars
Nov. 30, 2022
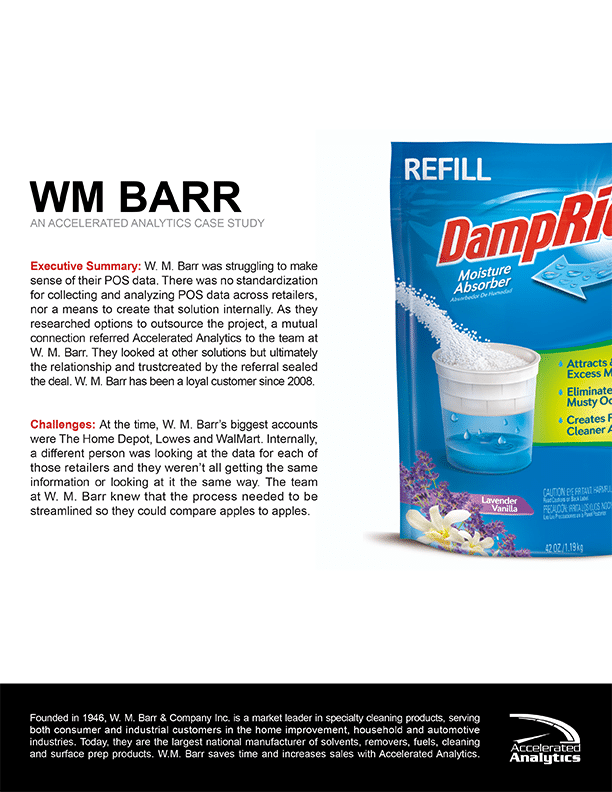
W.M. Barr
Learn how just one of our reports gave W.M. Barr the insight to place over $700,000 of incremental income in a single year!
Case Study

Oct. 3, 2022
Safety Stock – Accelerated Analytics reviews
In a perfect world, we would never run out of stock. Unfortunately, it’s not a perfect world and at some point, it can happen to you. To reduce the risk of stock out, companies maintain Safety Stock. Let’s dive into Safety Stock and how you can employ it to your advantage.
Infographic
Aug. 17, 2022
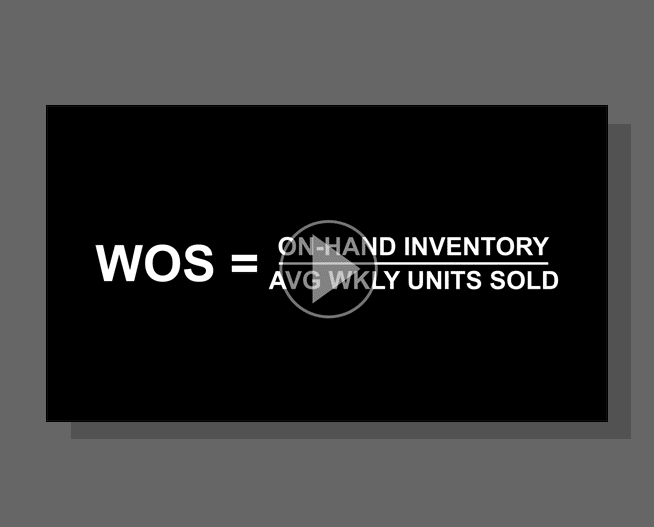
Calculating Weeks of Supply (WOS)
For 15 years, Accelerated Analytics has provided key retail analysis and business intelligence for brands across the globe. From long-range retail weather reports to updated consumer statistics. In this short Retail Data Brief video, we quickly review calculating Weeks Of Supply (or WOS).
Video
Jun. 3, 2022
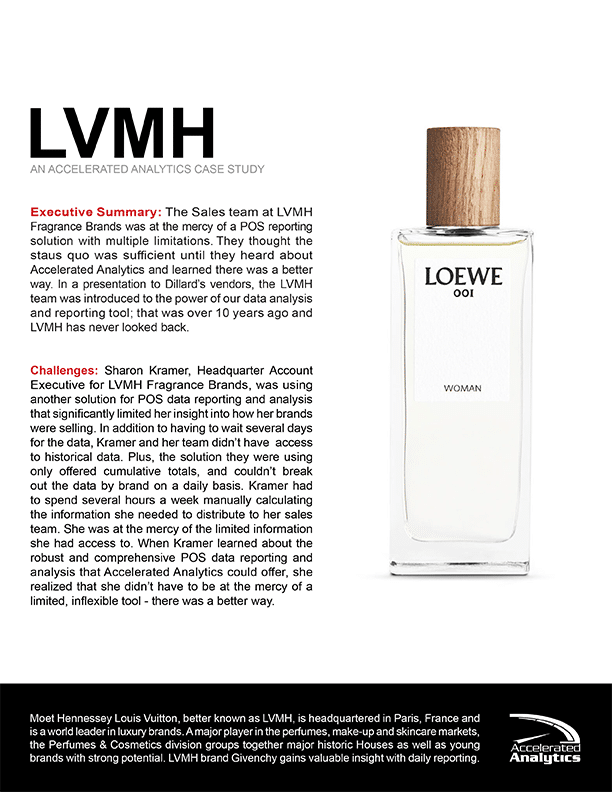
LVMH
Learn exactly what data LVMH can now see every day by store and brand, and how historical data has helped them plan for promotions and seasonal selling.
Case Study

Apr. 27, 2022
Out of Stock Analysis
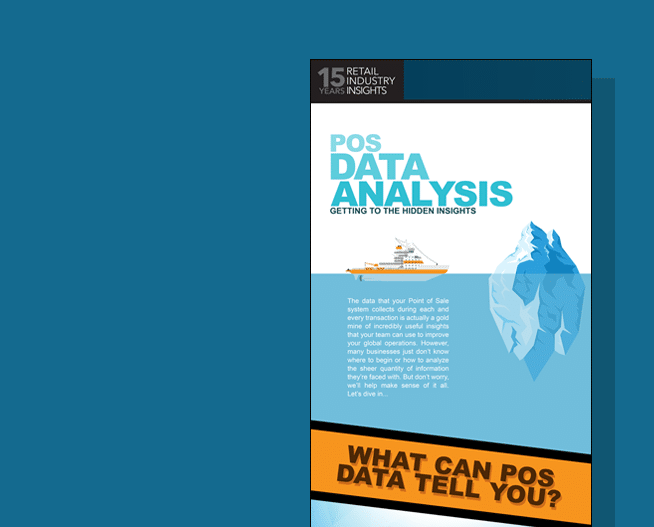
Analyzing point of sale data can be a daunting task. Our whitepaper series contains four “how-to” guides with simple step-by-step processes for completing key analysis of your POS data.
Whitepaper
Dec. 1, 2021
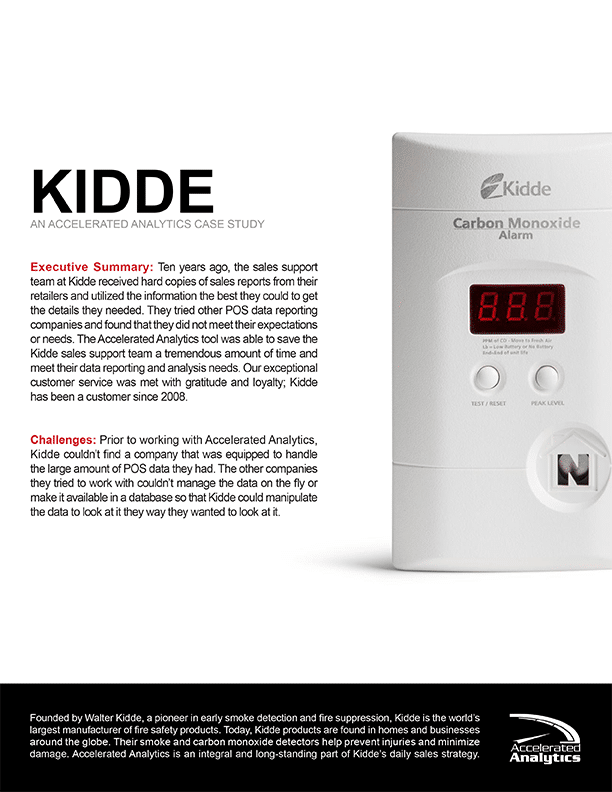
Kidde
Learn how store-level detail and exceptional customer service has made Kidde one of our most loyal customers.
Case Study
Oct. 25, 2021
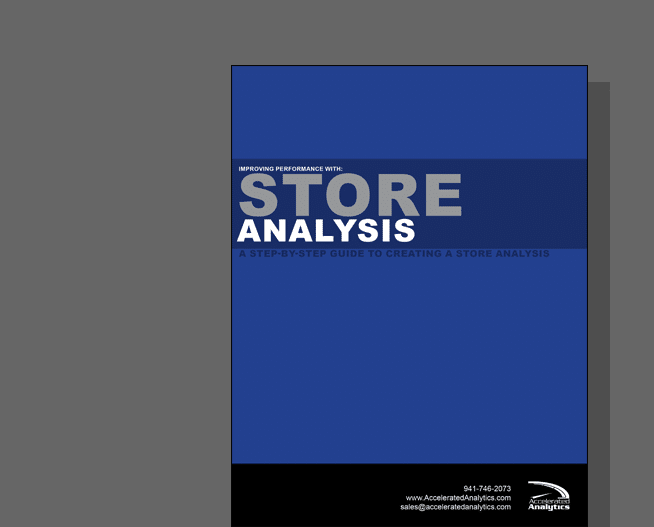
Store Analysis
Analyzing point of sale data can be a daunting task. Our whitepaper series contains four “how-to” guides with simple step-by-step processes for completing key analysis of your POS data.
Whitepaper
Aug. 30, 2021
Whitepaper: SKU Analysis
Analyzing point of sale data can be a daunting task. Our whitepaper series contains four “how-to” guides with simple step-by-step processes for completing key analysis of your POS data.
Whitepaper
Jul. 30, 2021
SKU Forecast
Analyzing point of sale data can be a daunting task. Our whitepaper series contains four “how-to” guides with simple step-by-step processes for completing key analysis of your POS data.
Whitepaper
Jun. 13, 2021
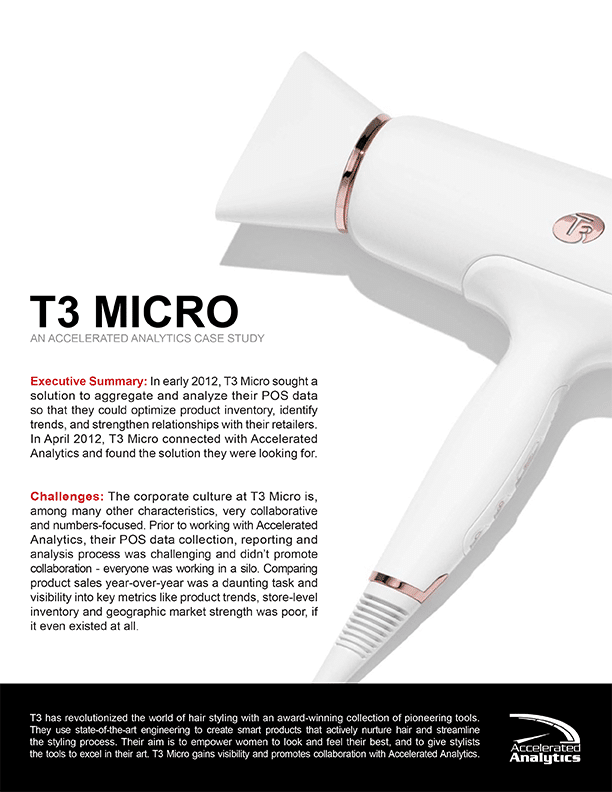
T3 Micro
Discover how T3 Micro leveraged Accelerated Analytics’ multi-team data collection and reporting features promoted visibility and collaboration across teams.
Case Study
May. 16, 2021
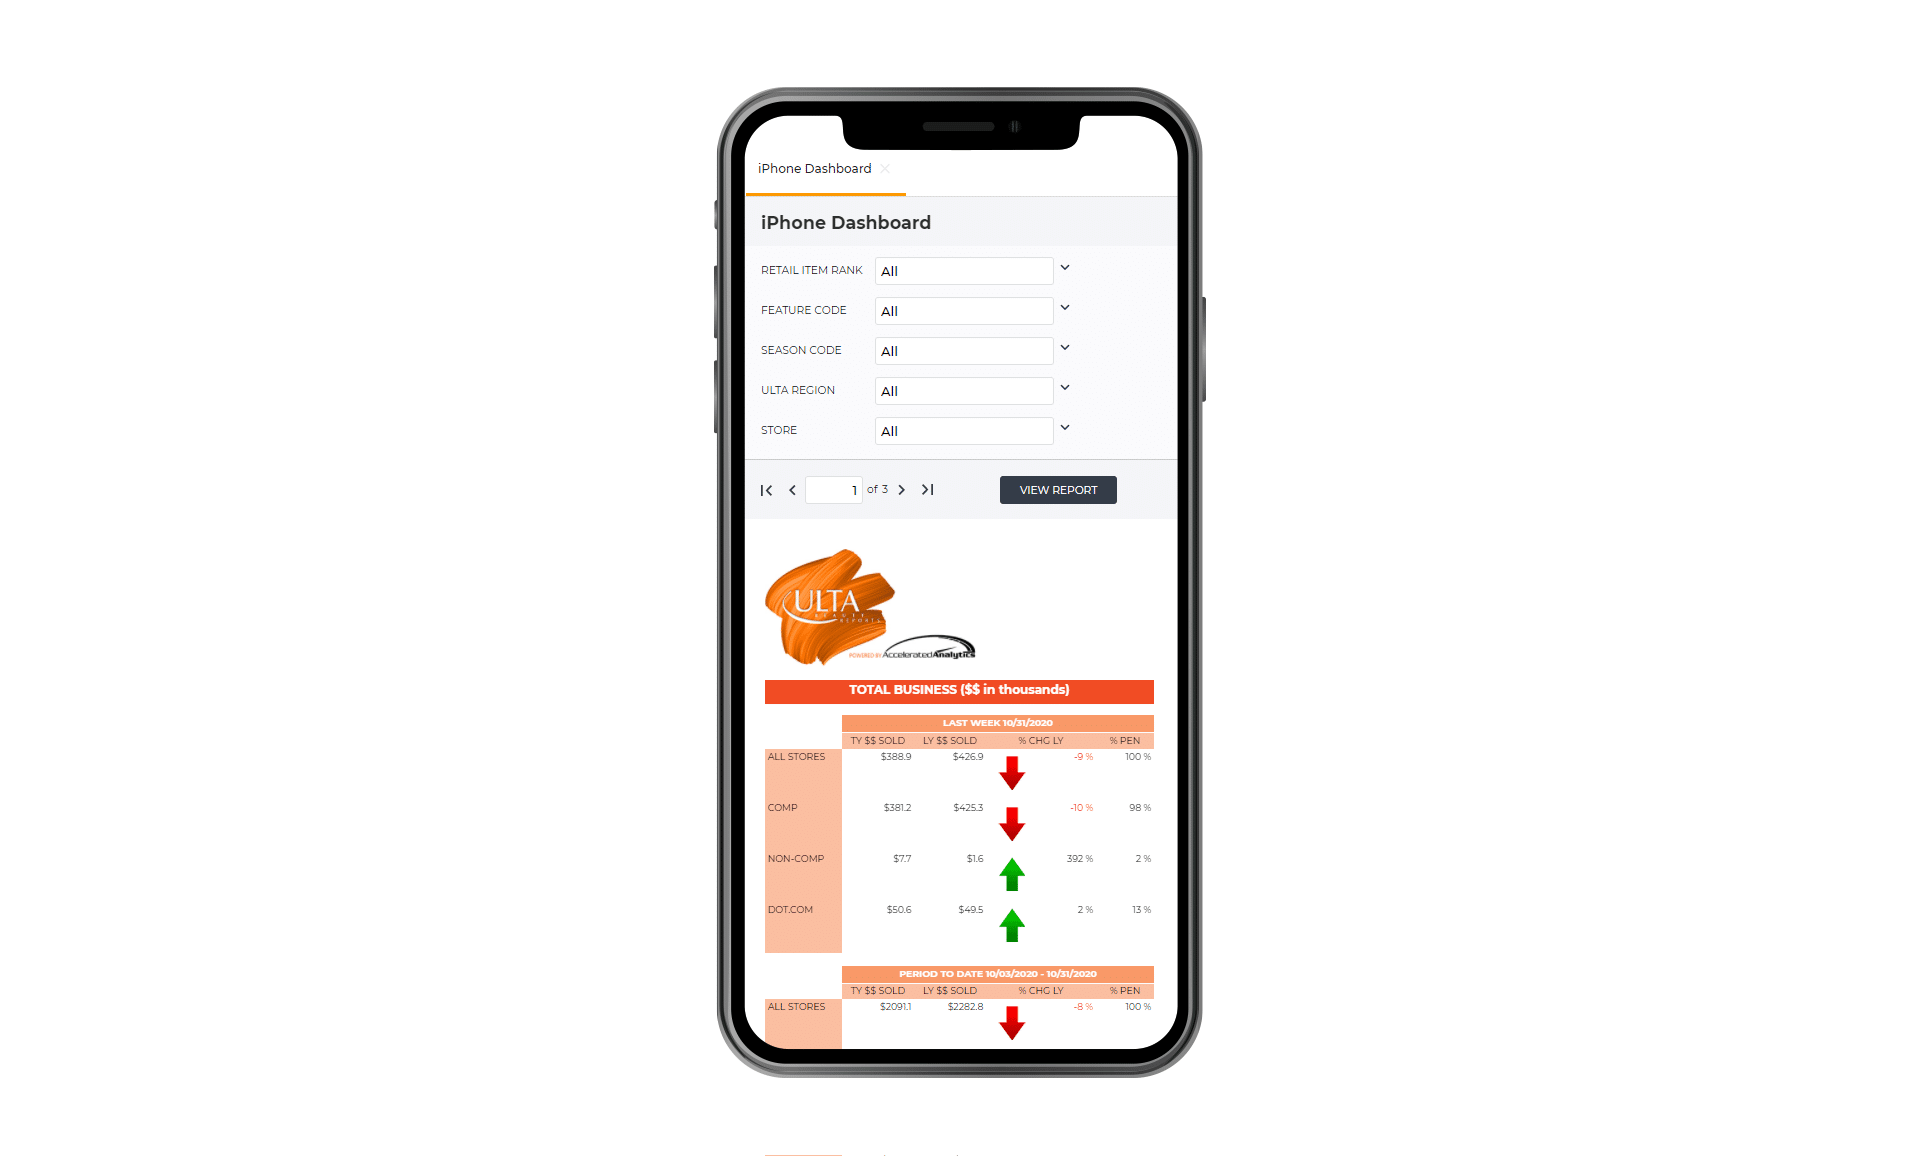
Accelerated Analytics – Ulta iPhone Dashboard
In this video, we provide an overview of the Accelerated Analytics Ulta iPhone Dashboard. Be sure to schedule your platform demo today at sales@acceleratedanalytics.com!
Video
Apr. 6, 2021
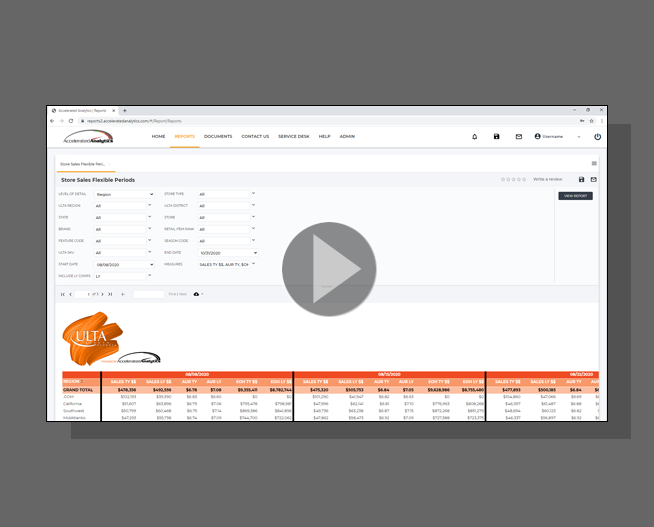
Accelerated Analytics – Ulta SKU Sales Rolling & Flexible Periods Reports
In this video, we provide an overview of the Accelerated Analytics Ulta SKU Sales Rolling & Flexible Periods Reports. Be sure to schedule your platform demo today at sales@acceleratedanalytics.com!
Video


Sep. 10, 2020
Florida 2020 DIY Home & Hardware Market Report
Accelerated Analytics® is tracking 511 stores across Ace Hardware, The Home Depot and Lowe’s. This FL Market Report provides a deep dive into the 10 unique DMA’s, identifies competition by submarkets & provides detailed statistics on store counts.
Industry Research

Aug. 25, 2020
Washington 2020 DIY Home & Hardware Market Report
We are tracking 190 stores across Ace Hardware, The Home Depot, Lowe’s and Menards in the Washington market. This market report provides a deep dive into the 4 unique DMA’s, identifies competition by submarkets, and provides detailed stats on store counts.
Industry Research

Aug. 3, 2020
(What is) ABC Analysis?
For 15 years, Accelerated Analytics has provided key retail analysis and business intelligence for brands across the globe. From long-range retail weather reports to updated consumer statistics. In this short Retail Data Brief video, we quickly review ABC Analysis.
Video

Jul. 30, 2020
California 2020 DIY Home & Hardware Market Report
Accelerated Analytics® is tracking 614 stores across Ace Hardware, The Home Depot and Lowe’s. This CA Market Report provides a deep dive into the 15 unique DMA’s, identifies competition by submarkets & provides detailed statistics on store counts.
Industry Research

Jul. 2, 2020
Illinois 2020 DIY Home & Hardware Market Report
We are tracking 295 stores across Ace Hardware, The Home Depot, Lowe’s and Menards in the Illinois market. This market report provides a deep dive into the 10 unique DMA’s, identifies competition by submarkets, and provides detailed stats on store counts.
Industry Research

Jun. 12, 2020
Georgia 2020 DIY Home & Hardware Market Report
Accelerated Analytics® is tracking 277 stores across Ace Hardware, The Home Depot and Lowe’s. This Georgia market report provides a deep dive into the 10 unique DMA’s, identifies competition by submarkets, and provides detailed statistics on store counts.
Industry Research

Jun. 5, 2020
Michigan 2020 DIY Home & Hardware Market Report
We are tracking 330 stores across Ace Hardware, The Home Depot, Lowe’s and Menards in the Michigan market. This market report provides a deep dive into the 11 unique DMA’s, identifies competition by submarkets, and provides detailed statistics on store counts.
Industry Research


May. 27, 2020
Texas 2020 DIY Home & Hardware Market Report
Accelerated Analytics® is tracking 502 stores across Ace Hardware, The Home Depot, and Lowe’s. This Texas market report provides a deep dive into the 20 unique DMA’s, identifies competition by submarkets, and provides detailed stats on store counts.
Industry Research

May. 14, 2020
Pennsylvania 2020 DIY Home & Hardware Market Report
We are tracking 268 stores across Ace Hardware, The Home Depot, Lowe’s and Menards in the Pennsylvania market. This market report provides a deep dive into the 11 unique DMA’s, identifies competition by submarkets, and provides detailed stats on store counts.
Industry Research

Apr. 22, 2020
Ohio 2020 DIY Home & Hardware Market Report
We are tracking 310 stores across Ace Hardware, The Home Depot, Lowe’s and Menards in the Ohio market. This market report provides a deep dive into the 12 unique DMA’s, identifies competition by submarkets, and provides detailed stats on store counts.
Industry Research
Mar. 17, 2020
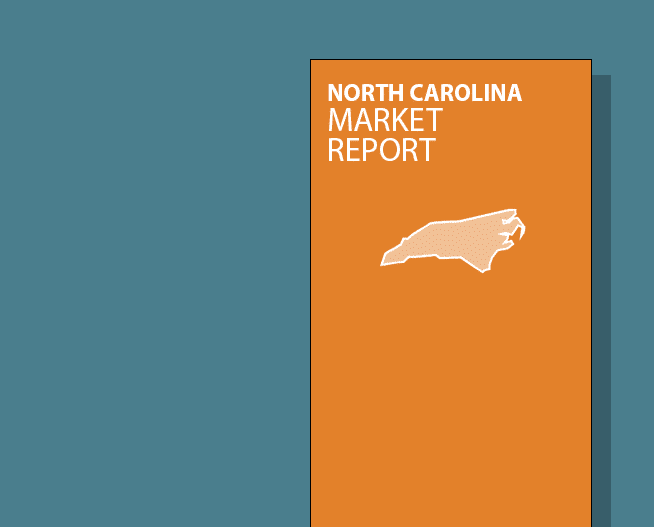
North Carolina 2020 DIY Home & Hardware Market Report
We are tracking 235 stores across Ace Hardware, The Home Depot, Lowe’s and Menards in the North Carolina market. This market report provides a deep dive into the 9 unique DMA’s, identifies competition by submarkets, and provides detailed stats on store counts.
Industry Research

Mar. 13, 2020
Vera Bradley
Learn exactly how seeing all of their sales data across retailers in a consistent format helped the team at Vera Bradley react quickly and capitalize on opportunities.
Case Study

Feb. 22, 2020
New York 2020 DIY Home & Hardware Market Report
Accelerated Analytics® is tracking 312 stores across Ace Hardware, The Home Depot and Lowe’s. This New York market report provides a deep dive into the 10 unique DMA’s, identifies competition by submarkets, and provides detailed statistics on store counts.
Industry Research

Jan. 15, 2020
Minnesota 2020 DIY Home & Hardware Market Report
We are tracking 192 stores across Ace Hardware, The Home Depot, Lowe’s and Menards in the Minnesota market. This market report provides a deep dive into the 7 unique DMA’s, identifies competition by submarkets, and provides detailed stats on store counts.
Industry Research

Dec. 13, 2019
EDI 852 POS Data Reporting in 2020 – An Infographic By Accelerated Analytics
Infographic
Nov. 21, 2019
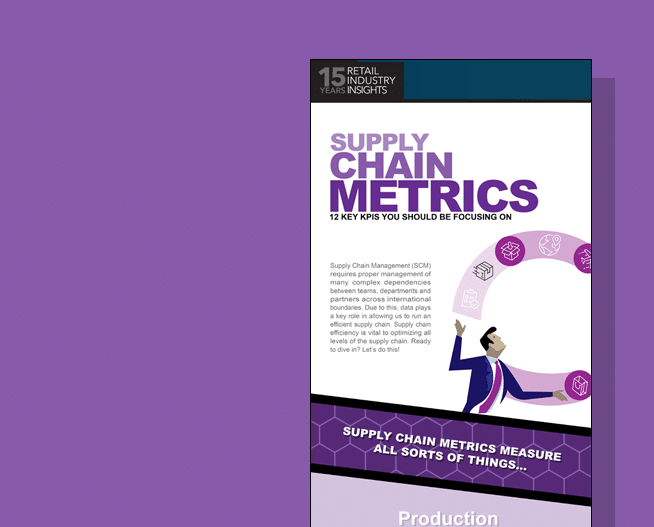
Supply Chain Metrics: 12 key KPI’s you should be focusing on (part 2 of 2)
For 15 years, Accelerated Analytics has provided key retail analysis and business intelligence for brands across the globe. From long-range retail weather reports to updated consumer statistics. In this short Retail Data Brief video, we quickly review the remaining 6 of 12 key Supply Chain metrics you should be focusing on. Part 1 of… Read more »
Video
Nov. 21, 2019
Supply Chain Metrics: 12 key KPI’s you should be focusing on (part 1 of 2)
For 15 years, Accelerated Analytics has provided key retail analysis and business intelligence for brands across the globe. From long-range retail weather reports to updated consumer statistics. In this short Retail Data Brief video, we quickly review the first 6 of 12 key Supply Chain metrics you should be focusing on. Part 2 of… Read more »
Video


Aug. 14, 2019
Reorder Point Formula (ROF)
For 15 years, Accelerated Analytics has provided key retail analysis and business intelligence for brands across the globe. From long-range retail weather reports to updated consumer statistics. In this short Retail Data Brief video, we quickly review Reorder Point Formula (or ROF).
Video


Apr. 8, 2019
Retail Myths & Facts: 2019
20+ retail facts that affect your business in 2019 – some of them will surprise you!
Infographic

Apr. 7, 2019
Retail’s Latest Trend: Pet Products
10 surprising facts about the pet product sector of retail – #4 is shocking!
Infographic

Apr. 2, 2019
Presentation: What’s New, Trending and Next with Dillard’s & Accelerated Analytics
Industry Research

Mar. 8, 2019
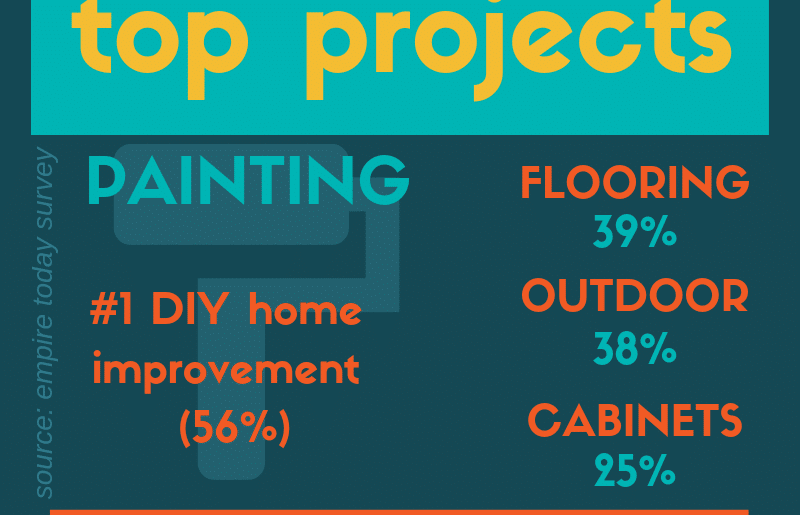
DIY Retail
& Top Projects in DIY
DIY projects are undertaken every day…read on to find out what the most common projects are, where DIY-ers are finding inspiration, and where they’re shopping for materials.
Infographic
Mar. 8, 2019
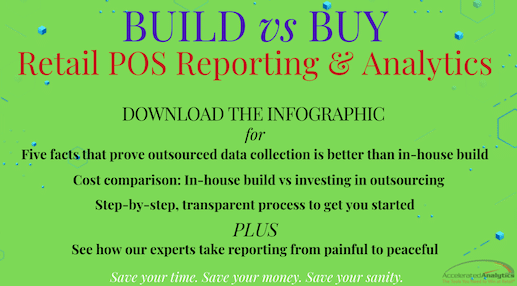
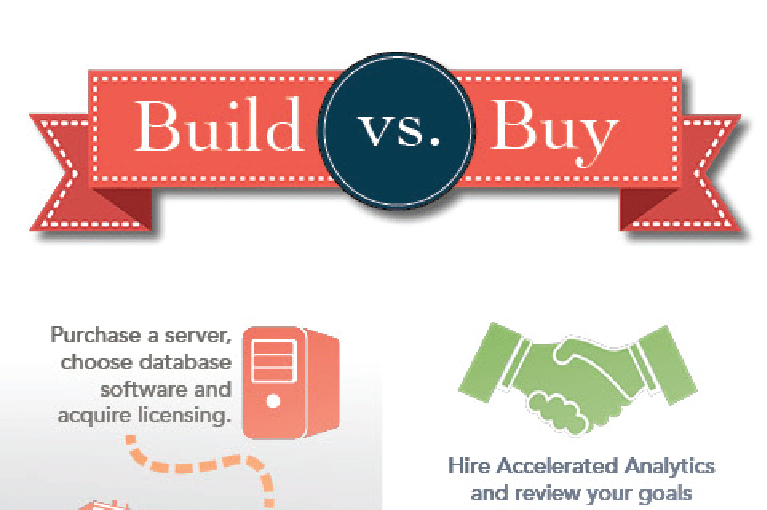
Build vs. Buy
Retail POS Reporting & Analytics
Outsourcing your POS data reporting and analytics is faster, easier and less expensive than building an in-house solution.
Infographic
Mar. 8, 2019
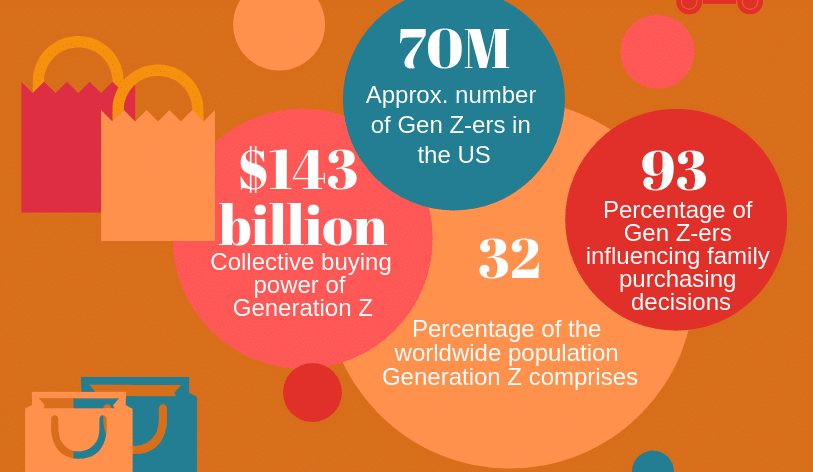
Generation Z: Changing the World of Retail
Want to know more? Click the image to read the full article.
Infographic

Feb. 26, 2019
Accelerated Analytics for Dillard’s Vendors
Learn how together, Dillard’s and Accelerated Analytics give vendors the best reports possible to run their business successfully at Dillard’s!
Video
Feb. 25, 2019
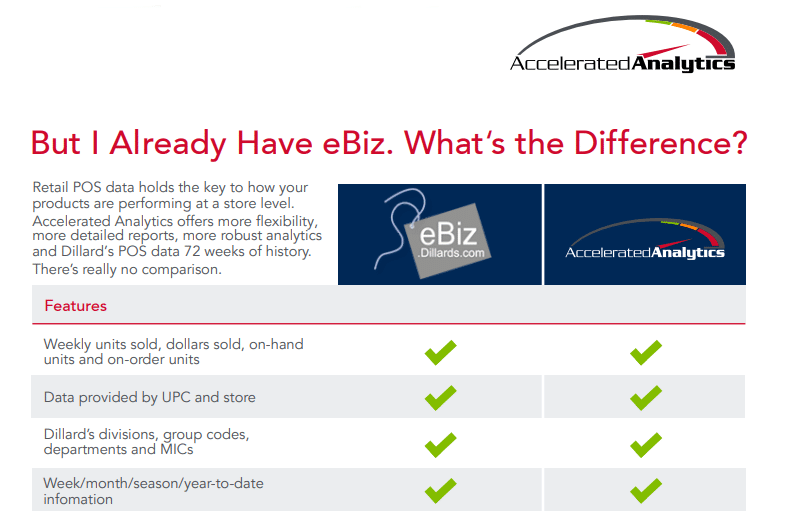
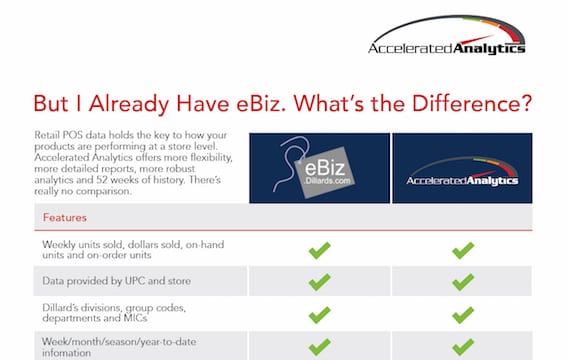
But I Already Have eBiz. What’s the Difference?
Retail POS data holds the key to how your products are performing at a store level. We offer more flexibility, more detailed reports, more robust analytics and Dillard’s POS data 72 weeks of history. There’s really no comparison.
Infographic

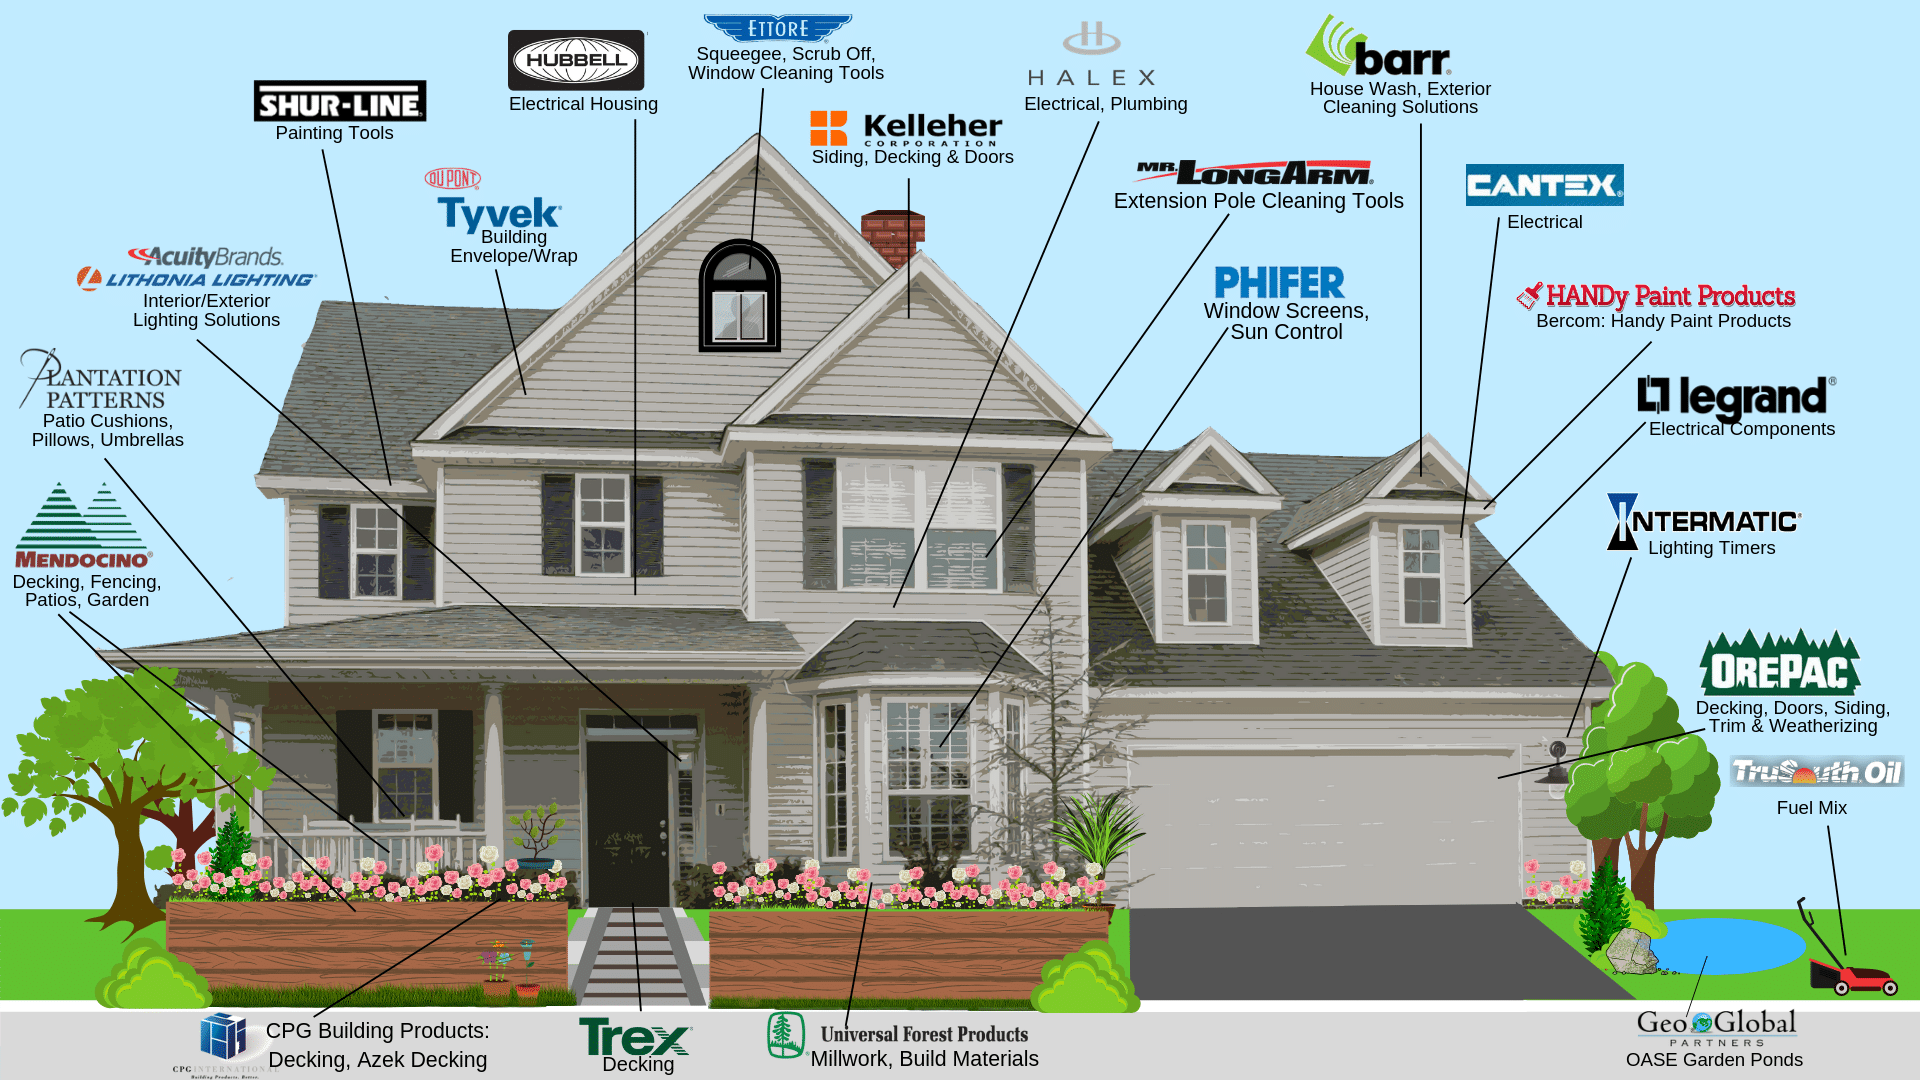
Aug. 28, 2018
Our Beauty and Fashion Brands
How many Beauty and Fashion Brands will you find in the Accelerated Analytics House? Download our newest infographic to see all 40 of the beauty and fashion brands we work with – you probably have more than a few in your own home!
May. 26, 2018
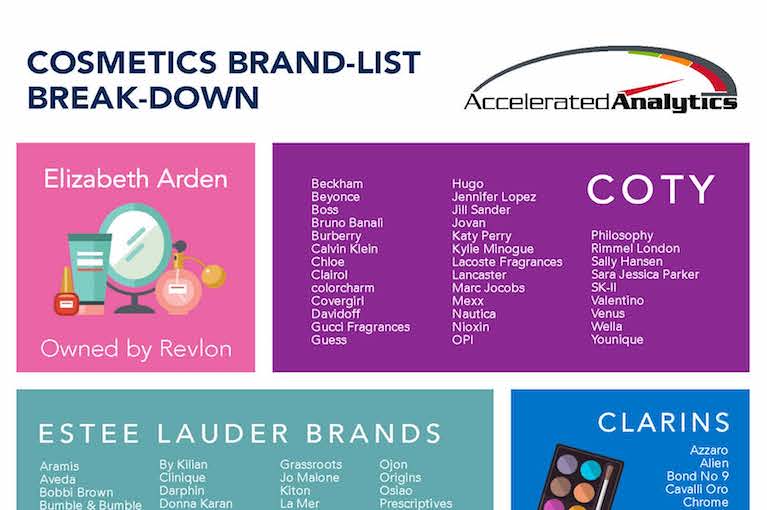
Cosmetics Brands We Work With
Ever wonder which cosmetic companies own which brands? See a comprehensive list of the cosmetic companies and brands we work with.
Infographic

Feb. 20, 2018
DIY is Our Sweet Spot
Learn more about or Report Power Packs expertly crafted for home & hardware brands.
Video
Feb. 18, 2018
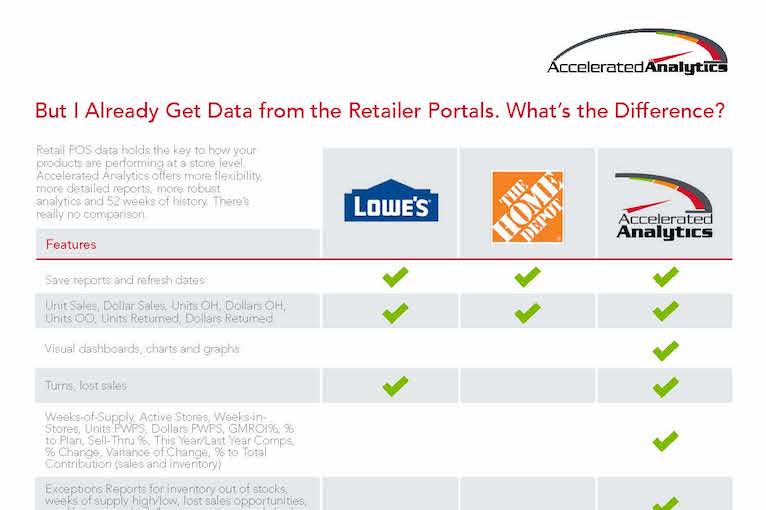
Side-by-side Reporting Comparison – Lowe’s DART & AA
See exactly how Home Depot Link, Lowe’s DART and Accelerated Analytics compare across 19 features. With more flexibility, more detailed reports, more robust analytics and 52 weeks of history, there’s really no comparison.
Infographic

Jul. 17, 2017
The Value of Leveraging POS Data for Beauty Vendors
Compare common internal processes with POS reporting & analytics provided by Accelerated Analytics. See the ROI you can expect from investing in Accelerated Analytics.
Infographic
Mar. 22, 2017
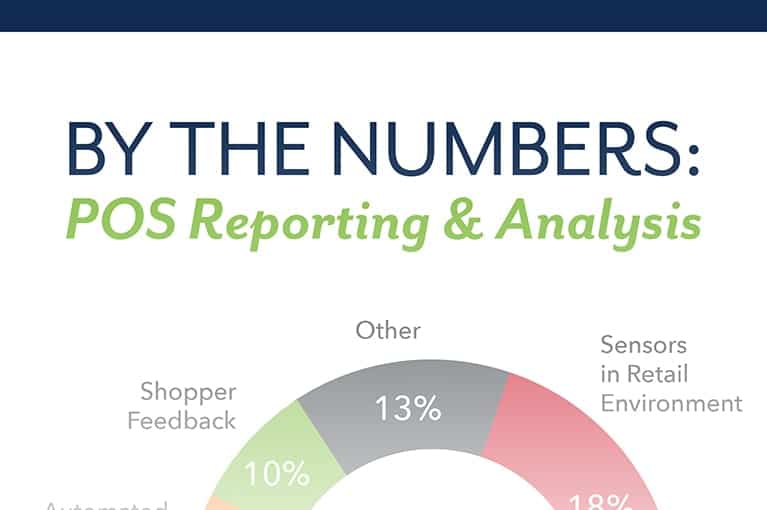
POS Reporting and Analysis By the Numbers
Take a close look at the revealing figures and statistics we’ve compiled about POS Reporting and Analysis.
Infographic

Mar. 14, 2017
The Evolution of Analytics
Where does your company fall on the evolutionary steps of Retail POS Analytics? And are you ready to take the next step?
Infographic
May. 19, 2016
Build vs. Buy
Retail POS Reporting and Analytics: Build vs. Buy. Outsourcing your POS data reporting and analytics is faster, easier and less expensive than building an in-house solution.
Infographic
Mar. 20, 2016
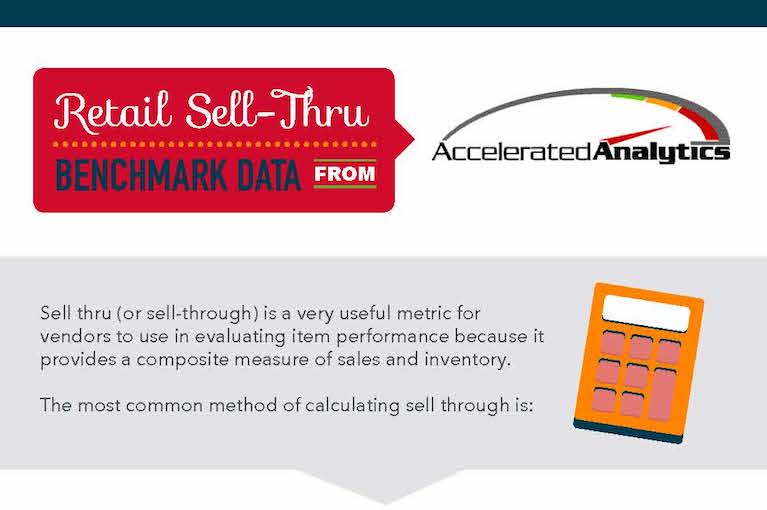
Sell-Through Bench Mark Data
How does your sell-thru percentage compare to the benchmark data we’ve compiled? The infographic includes the average sell-thru percentage for eight retail categories each at 8, 13, 26 and 52 weeks.
Infographic

Jun. 6, 2015
Managing by Exception
Learn how to cut through the clutter of POS data and find the challenges and opportunities quickly by applying exceptions to your POS data.
Video
Jun. 6, 2015
Learn More About Accelerated Analytics
Check out this brief demo of our software to see how we can improve your POS reporting and analysis.
Video
Mar. 2, 2015
Store Grade Analysis
Learn how to analyze store performance and apply grades (A,B,C,D) to each store for more meaningful and effective analysis.
Video
Jan. 1, 2015
eBiz versus Accelerated Analytics
Retail POS data holds the key to how your products are performing on a store level. EBiz gives you some basics but Accelerated Analytics offers so much more. See the difference!
Apr. 27, 2022
Out of Stock Analysis
Analyzing point of sale data can be a daunting task. Our whitepaper series contains four “how-to” guides with simple step-by-step processes for completing key analysis of your POS data.
Whitepaper
Oct. 25, 2021
Store Analysis
Analyzing point of sale data can be a daunting task. Our whitepaper series contains four “how-to” guides with simple step-by-step processes for completing key analysis of your POS data.
Whitepaper
Aug. 30, 2021
Whitepaper: SKU Analysis
Analyzing point of sale data can be a daunting task. Our whitepaper series contains four “how-to” guides with simple step-by-step processes for completing key analysis of your POS data.
Whitepaper
Jul. 30, 2021
SKU Forecast
Analyzing point of sale data can be a daunting task. Our whitepaper series contains four “how-to” guides with simple step-by-step processes for completing key analysis of your POS data.
Whitepaper
Oct. 3, 2022
Safety Stock – Accelerated Analytics reviews
In a perfect world, we would never run out of stock. Unfortunately, it’s not a perfect world and at some point, it can happen to you. To reduce the risk of stock out, companies maintain Safety Stock. Let’s dive into Safety Stock and how you can employ it to your advantage.
Infographic
Dec. 13, 2019
EDI 852 POS Data Reporting in 2020 – An Infographic By Accelerated Analytics
Infographic
Apr. 8, 2019
Retail Myths & Facts: 2019
20+ retail facts that affect your business in 2019 – some of them will surprise you!
Infographic
Apr. 7, 2019
Retail’s Latest Trend: Pet Products
10 surprising facts about the pet product sector of retail – #4 is shocking!
Infographic
Mar. 8, 2019
DIY Retail
& Top Projects in DIY
DIY projects are undertaken every day…read on to find out what the most common projects are, where DIY-ers are finding inspiration, and where they’re shopping for materials.
Infographic
Mar. 8, 2019
Build vs. Buy
Retail POS Reporting & Analytics
Outsourcing your POS data reporting and analytics is faster, easier and less expensive than building an in-house solution.
Infographic
Mar. 8, 2019
Generation Z: Changing the World of Retail
Want to know more? Click the image to read the full article.
Infographic
Feb. 25, 2019
But I Already Have eBiz. What’s the Difference?
Retail POS data holds the key to how your products are performing at a store level. We offer more flexibility, more detailed reports, more robust analytics and Dillard’s POS data 72 weeks of history. There’s really no comparison.
Infographic
May. 26, 2018
Cosmetics Brands We Work With
Ever wonder which cosmetic companies own which brands? See a comprehensive list of the cosmetic companies and brands we work with.
Infographic
Feb. 18, 2018
Side-by-side Reporting Comparison – Lowe’s DART & AA
See exactly how Home Depot Link, Lowe’s DART and Accelerated Analytics compare across 19 features. With more flexibility, more detailed reports, more robust analytics and 52 weeks of history, there’s really no comparison.
Infographic
Jul. 17, 2017
The Value of Leveraging POS Data for Beauty Vendors
Compare common internal processes with POS reporting & analytics provided by Accelerated Analytics. See the ROI you can expect from investing in Accelerated Analytics.
Infographic
Mar. 22, 2017
POS Reporting and Analysis By the Numbers
Take a close look at the revealing figures and statistics we’ve compiled about POS Reporting and Analysis.
Infographic
Mar. 14, 2017
The Evolution of Analytics
Where does your company fall on the evolutionary steps of Retail POS Analytics? And are you ready to take the next step?
Infographic
May. 19, 2016
Build vs. Buy
Retail POS Reporting and Analytics: Build vs. Buy. Outsourcing your POS data reporting and analytics is faster, easier and less expensive than building an in-house solution.
Infographic
Mar. 20, 2016
Sell-Through Bench Mark Data
How does your sell-thru percentage compare to the benchmark data we’ve compiled? The infographic includes the average sell-thru percentage for eight retail categories each at 8, 13, 26 and 52 weeks.
Infographic
Sep. 10, 2020
Florida 2020 DIY Home & Hardware Market Report
Accelerated Analytics® is tracking 511 stores across Ace Hardware, The Home Depot and Lowe’s. This FL Market Report provides a deep dive into the 10 unique DMA’s, identifies competition by submarkets & provides detailed statistics on store counts.
Industry Research
Aug. 25, 2020
Washington 2020 DIY Home & Hardware Market Report
We are tracking 190 stores across Ace Hardware, The Home Depot, Lowe’s and Menards in the Washington market. This market report provides a deep dive into the 4 unique DMA’s, identifies competition by submarkets, and provides detailed stats on store counts.
Industry Research
Jul. 30, 2020
California 2020 DIY Home & Hardware Market Report
Accelerated Analytics® is tracking 614 stores across Ace Hardware, The Home Depot and Lowe’s. This CA Market Report provides a deep dive into the 15 unique DMA’s, identifies competition by submarkets & provides detailed statistics on store counts.
Industry Research
Jul. 2, 2020
Illinois 2020 DIY Home & Hardware Market Report
We are tracking 295 stores across Ace Hardware, The Home Depot, Lowe’s and Menards in the Illinois market. This market report provides a deep dive into the 10 unique DMA’s, identifies competition by submarkets, and provides detailed stats on store counts.
Industry Research
Jun. 12, 2020
Georgia 2020 DIY Home & Hardware Market Report
Accelerated Analytics® is tracking 277 stores across Ace Hardware, The Home Depot and Lowe’s. This Georgia market report provides a deep dive into the 10 unique DMA’s, identifies competition by submarkets, and provides detailed statistics on store counts.
Industry Research
Jun. 5, 2020
Michigan 2020 DIY Home & Hardware Market Report
We are tracking 330 stores across Ace Hardware, The Home Depot, Lowe’s and Menards in the Michigan market. This market report provides a deep dive into the 11 unique DMA’s, identifies competition by submarkets, and provides detailed statistics on store counts.
Industry Research
May. 27, 2020
Texas 2020 DIY Home & Hardware Market Report
Accelerated Analytics® is tracking 502 stores across Ace Hardware, The Home Depot, and Lowe’s. This Texas market report provides a deep dive into the 20 unique DMA’s, identifies competition by submarkets, and provides detailed stats on store counts.
Industry Research
May. 14, 2020
Pennsylvania 2020 DIY Home & Hardware Market Report
We are tracking 268 stores across Ace Hardware, The Home Depot, Lowe’s and Menards in the Pennsylvania market. This market report provides a deep dive into the 11 unique DMA’s, identifies competition by submarkets, and provides detailed stats on store counts.
Industry Research
Apr. 22, 2020
Ohio 2020 DIY Home & Hardware Market Report
We are tracking 310 stores across Ace Hardware, The Home Depot, Lowe’s and Menards in the Ohio market. This market report provides a deep dive into the 12 unique DMA’s, identifies competition by submarkets, and provides detailed stats on store counts.
Industry Research
Mar. 17, 2020
North Carolina 2020 DIY Home & Hardware Market Report
We are tracking 235 stores across Ace Hardware, The Home Depot, Lowe’s and Menards in the North Carolina market. This market report provides a deep dive into the 9 unique DMA’s, identifies competition by submarkets, and provides detailed stats on store counts.
Industry Research
Feb. 22, 2020
New York 2020 DIY Home & Hardware Market Report
Accelerated Analytics® is tracking 312 stores across Ace Hardware, The Home Depot and Lowe’s. This New York market report provides a deep dive into the 10 unique DMA’s, identifies competition by submarkets, and provides detailed statistics on store counts.
Industry Research
Jan. 15, 2020
Minnesota 2020 DIY Home & Hardware Market Report
We are tracking 192 stores across Ace Hardware, The Home Depot, Lowe’s and Menards in the Minnesota market. This market report provides a deep dive into the 7 unique DMA’s, identifies competition by submarkets, and provides detailed stats on store counts.
Industry Research
Apr. 2, 2019
Presentation: What’s New, Trending and Next with Dillard’s & Accelerated Analytics
Industry Research
Aug. 17, 2022
Calculating Weeks of Supply (WOS)
For 15 years, Accelerated Analytics has provided key retail analysis and business intelligence for brands across the globe. From long-range retail weather reports to updated consumer statistics. In this short Retail Data Brief video, we quickly review calculating Weeks Of Supply (or WOS).
Video
May. 16, 2021
Accelerated Analytics – Ulta iPhone Dashboard
In this video, we provide an overview of the Accelerated Analytics Ulta iPhone Dashboard. Be sure to schedule your platform demo today at sales@acceleratedanalytics.com!
Video
Apr. 6, 2021
Accelerated Analytics – Ulta SKU Sales Rolling & Flexible Periods Reports
In this video, we provide an overview of the Accelerated Analytics Ulta SKU Sales Rolling & Flexible Periods Reports. Be sure to schedule your platform demo today at sales@acceleratedanalytics.com!
Video
Aug. 3, 2020
(What is) ABC Analysis?
For 15 years, Accelerated Analytics has provided key retail analysis and business intelligence for brands across the globe. From long-range retail weather reports to updated consumer statistics. In this short Retail Data Brief video, we quickly review ABC Analysis.
Video
Nov. 21, 2019
Supply Chain Metrics: 12 key KPI’s you should be focusing on (part 2 of 2)
For 15 years, Accelerated Analytics has provided key retail analysis and business intelligence for brands across the globe. From long-range retail weather reports to updated consumer statistics. In this short Retail Data Brief video, we quickly review the remaining 6 of 12 key Supply Chain metrics you should be focusing on. Part 1 of… Read more »
Video
Nov. 21, 2019
Supply Chain Metrics: 12 key KPI’s you should be focusing on (part 1 of 2)
For 15 years, Accelerated Analytics has provided key retail analysis and business intelligence for brands across the globe. From long-range retail weather reports to updated consumer statistics. In this short Retail Data Brief video, we quickly review the first 6 of 12 key Supply Chain metrics you should be focusing on. Part 2 of… Read more »
Video
Aug. 14, 2019
Reorder Point Formula (ROF)
For 15 years, Accelerated Analytics has provided key retail analysis and business intelligence for brands across the globe. From long-range retail weather reports to updated consumer statistics. In this short Retail Data Brief video, we quickly review Reorder Point Formula (or ROF).
Video
Feb. 26, 2019
Accelerated Analytics for Dillard’s Vendors
Learn how together, Dillard’s and Accelerated Analytics give vendors the best reports possible to run their business successfully at Dillard’s!
Video
Feb. 20, 2018
DIY is Our Sweet Spot
Learn more about or Report Power Packs expertly crafted for home & hardware brands.
Video
Jun. 6, 2015
Managing by Exception
Learn how to cut through the clutter of POS data and find the challenges and opportunities quickly by applying exceptions to your POS data.
Video
Jun. 6, 2015
Learn More About Accelerated Analytics
Check out this brief demo of our software to see how we can improve your POS reporting and analysis.
Video
Mar. 2, 2015
Store Grade Analysis
Learn how to analyze store performance and apply grades (A,B,C,D) to each store for more meaningful and effective analysis.
Video
Nov. 30, 2022
W.M. Barr
Learn how just one of our reports gave W.M. Barr the insight to place over $700,000 of incremental income in a single year!
Case Study
Jun. 3, 2022
LVMH
Learn exactly what data LVMH can now see every day by store and brand, and how historical data has helped them plan for promotions and seasonal selling.
Case Study
Dec. 1, 2021
Kidde
Learn how store-level detail and exceptional customer service has made Kidde one of our most loyal customers.
Case Study
Jun. 13, 2021
T3 Micro
Discover how T3 Micro leveraged Accelerated Analytics’ multi-team data collection and reporting features promoted visibility and collaboration across teams.
Case Study
Mar. 13, 2020
Vera Bradley
Learn exactly how seeing all of their sales data across retailers in a consistent format helped the team at Vera Bradley react quickly and capitalize on opportunities.
Case Study