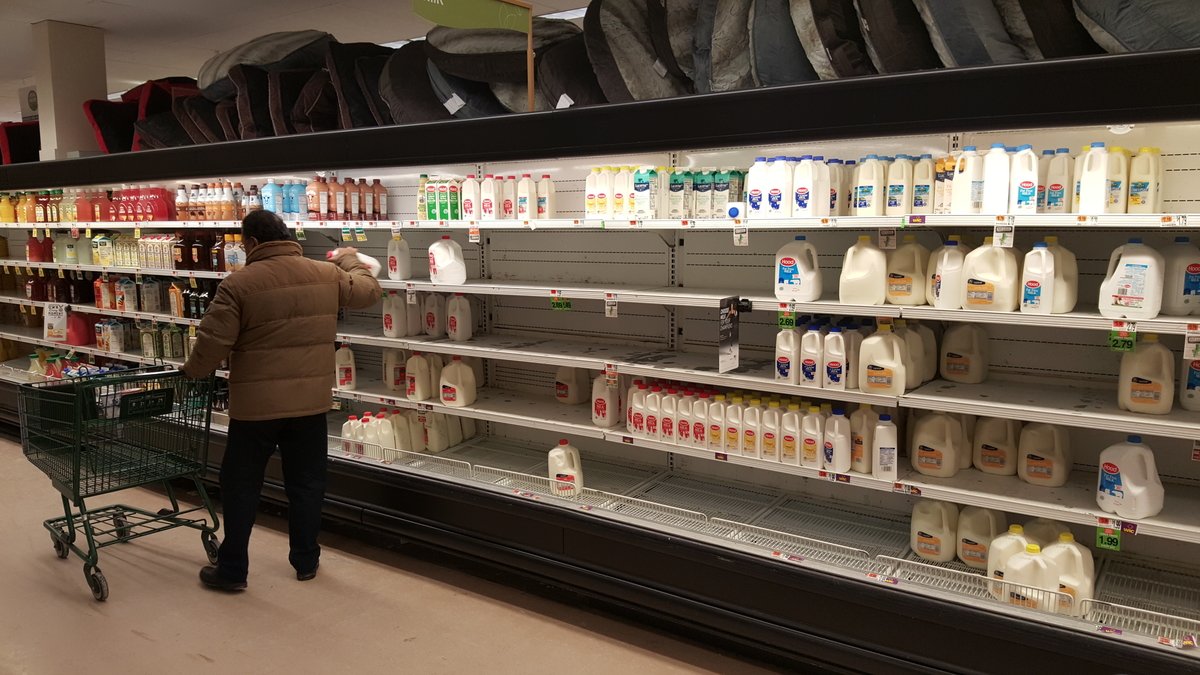
Retail Woes: Stock outs
We can all agree that retail business is a highly competitive sector, and that it’s imperative to make sure that your product is on the shelf when the customer is shopping for it. But for many brands, the problem of out-of-stocks (OOS) persists; in fact, a 2018 retail study revealed that the average out-of-stock rate in the US is close to 8 percent (up to 15 percent for advertised sale items). Why? And what can be done to quash this merchandising menace?
The problem of frequent out-of-stocks directly relates to profit loss, prompting loss prevention teams to explore and identify the causes and action steps to take to improve on-shelf availability (OSA). What’s more, persistent instances of out-of-stock items will cause the consumer to become frustrated and damage brand loyalty – essentially transferring your sales to your competitor.
Identifying Out-of-Stocks
Several factors contribute to stock problems. Some of them include:
Supply Chain Issues –
Was the product ordered and delivered in a timely manner? Production and/or shipping delays can slow down the process of getting products to the shelves, causing a disturbance in the consumer’s shopping experience.
Unreliable Data –
Shelf-level inventory data must be accurate to be of any real use. While POS inventory data provides the figures of how many units of each product should be in the store, there are instances of “lost” items – items that might be residing in the store’s warehouse rather than on the store shelves, shrinkage – items that may have been shoplifted or fraudulently returned, or simply administrative error. These instances can be identified through auditing.
Store Service Levels –
If an item was ordered online, was it successfully picked in the store? Additionally, if the store’s storage area (the “back room”) is crowded and/or disorganized, the problem of lost or misplaced merchandise can unnecessarily occur.
Other Factors to Consider
Day of the Week – Empty shelves are more likely to occur on Friday and Saturday.
Advertised Sale Items – Items on sale were found to have up to a 75 percent higher level of out-of-stock than full-priced items.
Categories – Groceries, nonperishables, bulk products – several variables between categories cause out-of-stock differences.
Store Size & Staff Morale – Supermarkets seem overall less likely to be out of stock than a big-box hub.
The ECR Community Shrink & OSA Group’s 2014 study Making the Link: The Role of Employee Engagement in Controlling Retail Losses reported that stores with lower level of employee satisfaction had twice the shelf out-of-stock rate than 8 percent average.
itsoutofstock.com/wp-content/uploads/2013/04/2005.pdf
The Impact of Out-of-Stocks
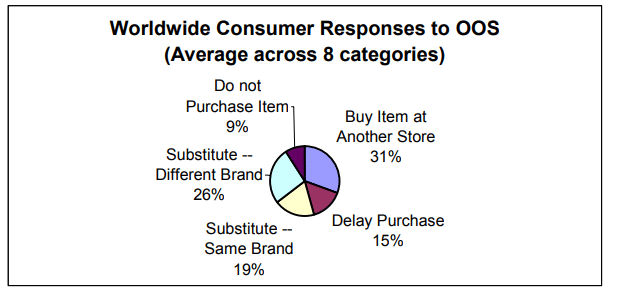
What retailers need to understand is the scale of the lost sales from these empty shelves; i.e., if the problem were to be completely fixed, how much would sales grow? To date, the approach taken to answering this question has been to understand from shoppers what they would do if they found their preferred item was out-of-stock. A 2008 study published by Corsten and Gruen determined that the retailer would incur a sales loss when the shopper takes one of the two following actions:
Does not buy anything (9 percent)
Buys the item at another store (27 percent)
They also estimated, evidencing a study by Data Ventures, a value loss of 7 percent when the shopper substitutes items and buys alternative brands at a lower retail price or smaller sizes of the same brand.
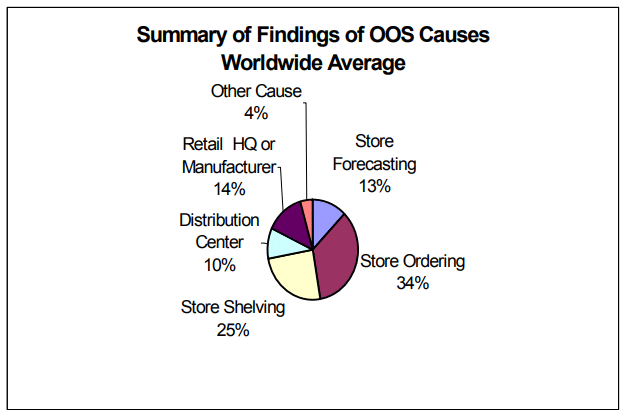
Causes of OOS
The question of how much of this loss is incurred at store level versus how much is the “fault” of the supply chain and other ‘outside’ factors has been widely researched and discussed; however, it’s more helpful to analyze, understand and remedy the causes of OOS.
Corsten and Gruen reported that breakdowns in the work process accounted for 91 percent of out-of-stock causes, namely store stocking, store forecasting, store ordering, planning, and supply.
Stocking Problems. Stores tend to generate out-of-stock incidences when they minimize the shelf quantity to accelerate the sale of clearance items or to reduce the quantity that thieves could steal on any one occasion. Of course, the reasons for the minimization will vary depending on the goods being sold.
Store Ordering. A major cause of shelf out-of-stocks for some high-loss products can simply be that no one knew that they had not been ordered. Items not correctly recorded as waste or damages, or simply stolen, will not reduce the perpetual inventory records; therefore, sales-based ordering systems will continue to show those items on the shelf, leading to replenishment orders not being made on time.
User Error. Bad data can cause both loss and out-of-stocks. For example, if a case of 20 units is shipped to a store but due to an input error only actually contains 10 units, those other 10 units will be recorded as a loss, and will also be unavailable to sell, even though the system thinks they are in stock.
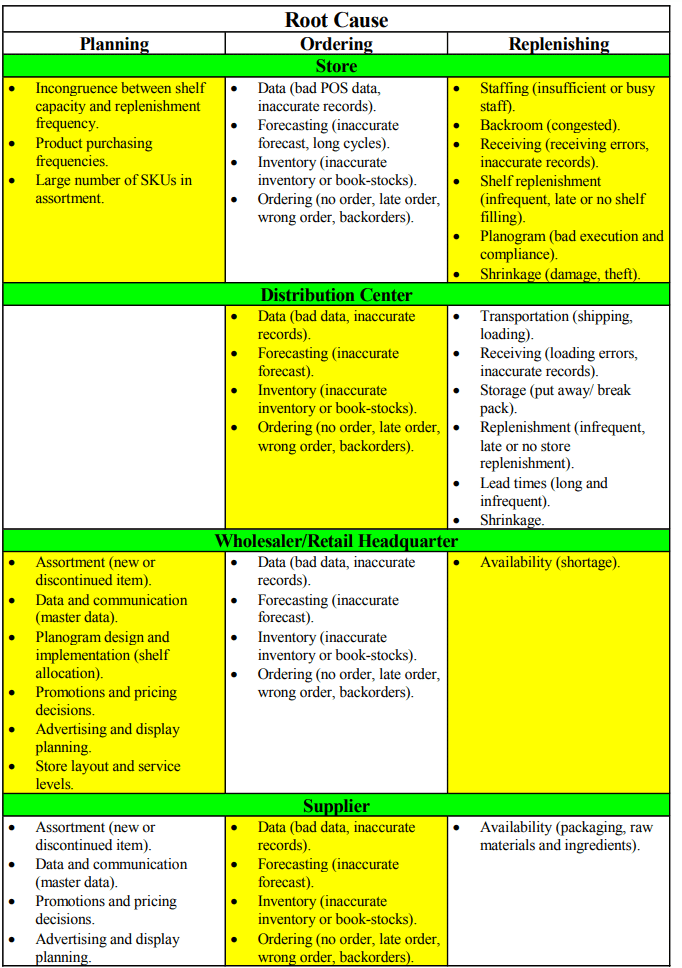
A breakdown of these root causes is below:
Addressing & Correcting Shelf OOS
An ECR Europe report suggested an approach that started with better measurement that would in turn lead to increased management attention in-store and in satellite offices.
The report recommended a strategy consisting of five actions: improve the replenishment systems; simplify the merchandising strategy; improve inventory record accuracy; better manage promotions; and develop more automated and collaborative store ordering systems.
Accelerated Analytics has created software to help manage all five of these actions and more. Since your data is automatically being gathered and organized all the time by our innovative software, you can generate in-depth data reports with as few as one single click.
For example, a Lost Dollars sold report calculates the dollars lost by week for a SKU across all the stores at their largest retail customer. The report is straightforward – it identifies every out-of-stock for a period of time and then calculates the average rate of sale by store. Since the average unit retail price is known, we can calculate the estimated sales lost by looking at the units which would have been sold had the product been in stock and multiply that number by the average unit price.
The ECR Europe report, published back in 2008, called for several arms of analysis to come together to reduce the OOS problem as much as possible:
Adopting a point-of-sale-based measure of on-shelf availability.
Moving to an automatic store ordering system.
Reducing and simplifying the assortment.
Ensuring that planograms are fit for purpose with the right shelf holding capacity.
Removing the errors in the master data file and store book stock systems.
Sharing data on sales and inventory with manufacturers.
Amazingly enough, a group of engineers and business analysts, later to be known as Accelerated Analytics, had come together in 2003 to create a single product that could handle all of a business’ data automatically and in real-time.

“Reducing out-of-stocks is a complex problem, with many moving parts… but you can’t manage and improve what you are not measuring. And it’s hard to believe a vendor is making an effort to reduce OOS if they are not measuring on-hand at their retail customers. If you are a vendor, then you need to proactively manage in-stock. That means if your retailer makes POS activity available at midnight Sunday, your team should be taking action by 11:00 a.m. Monday morning. Not just loading data into a spreadsheet, so they can start the analysis process. Or worse yet, not even receiving any data at all. Timely reporting and analysis on your in-stock and out-of-stock data across your retailers is a proactive step toward battling that steady, average out-of-stock rate of 8%.” – Accelerated’s Founder and CEO, Chad Symens
Related posts